


AMD stock valuation-The one of two only GPU providers

Background
In 2018, I learned from the news that semiconductors that “almost all technology in the future requires semiconductors.” However, all I did was put several semiconductor companies (AMD, Nvidia, and TSMC) on my stock watchlist because I did not know the technology or the stock analysis. I graduated in 2020 from a seemingly renown university with a finance degree and a 3.5 out of 4 GPA, but I found that most of the things I learned are not applicable to stock valuation. In 2021, I started to self-study stock analysis and began to value AMD(Advanced Mirco Devices stock). It takes me 15 days to 2 months to value a stock right now, but I spend a year to value AMD, the first stock I value. Because I was learning stock valuation by doing it. I got stuck multiple times; some took me several weeks or months. Every time I got stuck, I paused my valuation and learned how to figure it out.
On August 2nd, 2022, I finished my first AMD stock valuation. I posted all my stock valuations since then to have opportunities to receive feedback and disagreement. However, I haven’t been able to do that when I finished my first stock valuation, but the video below shows the record of work and estimated price when I shared it with my connection.(How much the company is worth rather than the traders’ price in the short term).
Two weeks ago this year, I started to revisit my AMD stock valuation and included two significant things I did not consider before:
1. How to estimate the company’s future stock options issued to its employees
2. How to take geopolitical risks such as trade bans and tariffs into account in the stock valuations.
Plan for this analysis
Part 1: Briefly explain semiconductor and AMD’s business nature-what the company is doing and how to make money.
Part 2: (Most crucial part for this analysis)
Explain a company’s growth rate and how stock compensation affects the company's growth rate. The growth rate explanation part is similar to that of the previous post, but I included new content about how to estimate how many stock options a company will issue to its employees in the future. You can jump to the “Stock-based compensation” part if you have read my previous analysis. Since we own a piece of the company as public stock investors but get paid after everyone else, estimating the value of future employee stock options is necessary. The more ownership the company’s employees can purchase at a lower price with stock options, the less left for public stockholders.
Part 3: Free cash flow, stock price, and estimating how geopolitical risk affects the company’s valuation.
The business world has experienced several geopolitical risks since 2016, including the US and China trade war, COVID-19 in 2020, the Russian invasion of Ukraine in 2022, and the Hamas attack on Israel in 2023. The primary concern for semiconductor companies is the US’s increasing export limitation to China. Part 3 explained how to take these factors into account in the valuation. After all, you will likely have capital loss when investing with no research. But if you want to invest until you are sure of everything, chances are you will never start investing from 2016 to now.
Business nature and model
This analysis will explain the GPU(graphic process unit), a specific type of chips AMD and Nvidia design. To learn basic knowledge about what semiconductors is, please check my previous TSMC valuation and ctrl+F “Part 1 Semiconductor industry and TSMC business model”.
To learn about what GPU is, let us start with the CPU, a more basic and common computer process unit. I know many of you may have known what CPU is, but my post is for people with zero background experience.
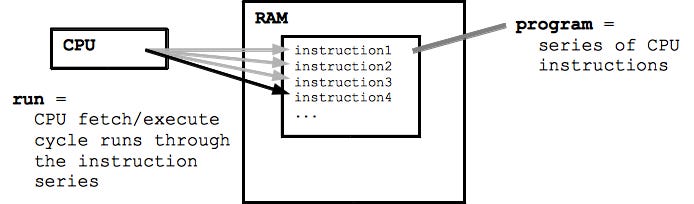
To learn about the CPU, think about how our brain works when we sense. Most people will have saliva and feel more hungry in their stomach when they smell declicious food. The month and stomach do not give instructions on how to take action by themselves. Instead, it is the brain that sends neurotransmitters to initiate the gland to release saliva and the pancreas to release insulin to make us people feel hungry. By the same token, the CPU is the central part of the computer that takes instructions from the program to tell which data to perform. The keyboard can not transfer your typing to words on the screen, but the CPU does it. Computers or other electronics without a CPU are like humans in PVS(persistent vegetative state) who cannot feel pain or hunger.
Human brain comparable to the CPU

But just like we will make more mistakes when multitasking, a single CPU cannot handle instructions when the instruction and calculation demand increases. And that is whether the GPU comes into play.
To explain the differences, recall how you applied for a visa to travel or work in a country. In the old times, you submitted visa applications to the consulate in your city, and then the embassy sent your documents to the foreign affairs department in the country you want to travel to. After your visa is approved, the destination country’s government sends the passport back to the embassy in your country, then the consulate in your city, taking a ton of time.
However, many European countries outsourced the services to an agency called VFS Global, and now applicants can submit visa applications in multiple cities, largely reducing the waiting time. If the CPU is like the foreign embassy, then GPU are VFS Global agencies.
Uses of GPU
VDI-Virtual desktop infrastructure
The full name of GPU is a graphic processing unit, and it was first used for gaming because video games need to transform visual images into information that the computer can understand. Just like we use numbers to represent quantity rather than show each of them on the document.
AI(Aritical intelligence)
AI is how computer systems perform tasks normally requiring human intelligence.
Machine learning teaches computers to make decisions like humans by giving them a ton of data and training them, while deep learning requires machines to learn from data like the human brain by using neural networks. Machine learning is like humans telling machines what is edible and not, while deep learning requires computers to figure out themselves. GPU is needed since CPU is unable to handle these “thinkings”.
HPC(High performance calculation)
You must have encountered a situation in which your laptop storage is insufficient after using it for two or three years. Companies dealing with millions or billions of data(like customer information) will need more space and saving them locally is either inefficient or expensive. So, HPC is a company’s ability to spread its computer-intensive workloads among multiple computer nodes or cloud servers. What are cloud servers? It is like you don’t have enough room to store your stuff, so you and other people rent a piece of huge public storage to store your stuff, and cloud servers are used for storing large amounts of data your computer storage cannot handle. The good thing with the cloud is that you only pay when you are using it, rather than buying a laptop with extensive storage, use less than half for the first three years and don’t have enough storage after year five.
You may not only need to store but also need to:
sort data (based on different categories)
filter data (pick meaningful data for you)
extract data (take specific data out from a large amount of data when you need)
So, the increased profit margin and demand for AMD and Nvidia GPU result from the increasing demand for high-performance computing every time. The demand derived from gaming and cryptocurrency mining from 2020 and 2021 and AI from 2022 until now. I would save the cryptocurrency mining explanation for later when I sell bitcoins, which I bought in 2018 to 2020 one day, but for this analysis, you just need to know AMD’s chips are used for high-performance computing.
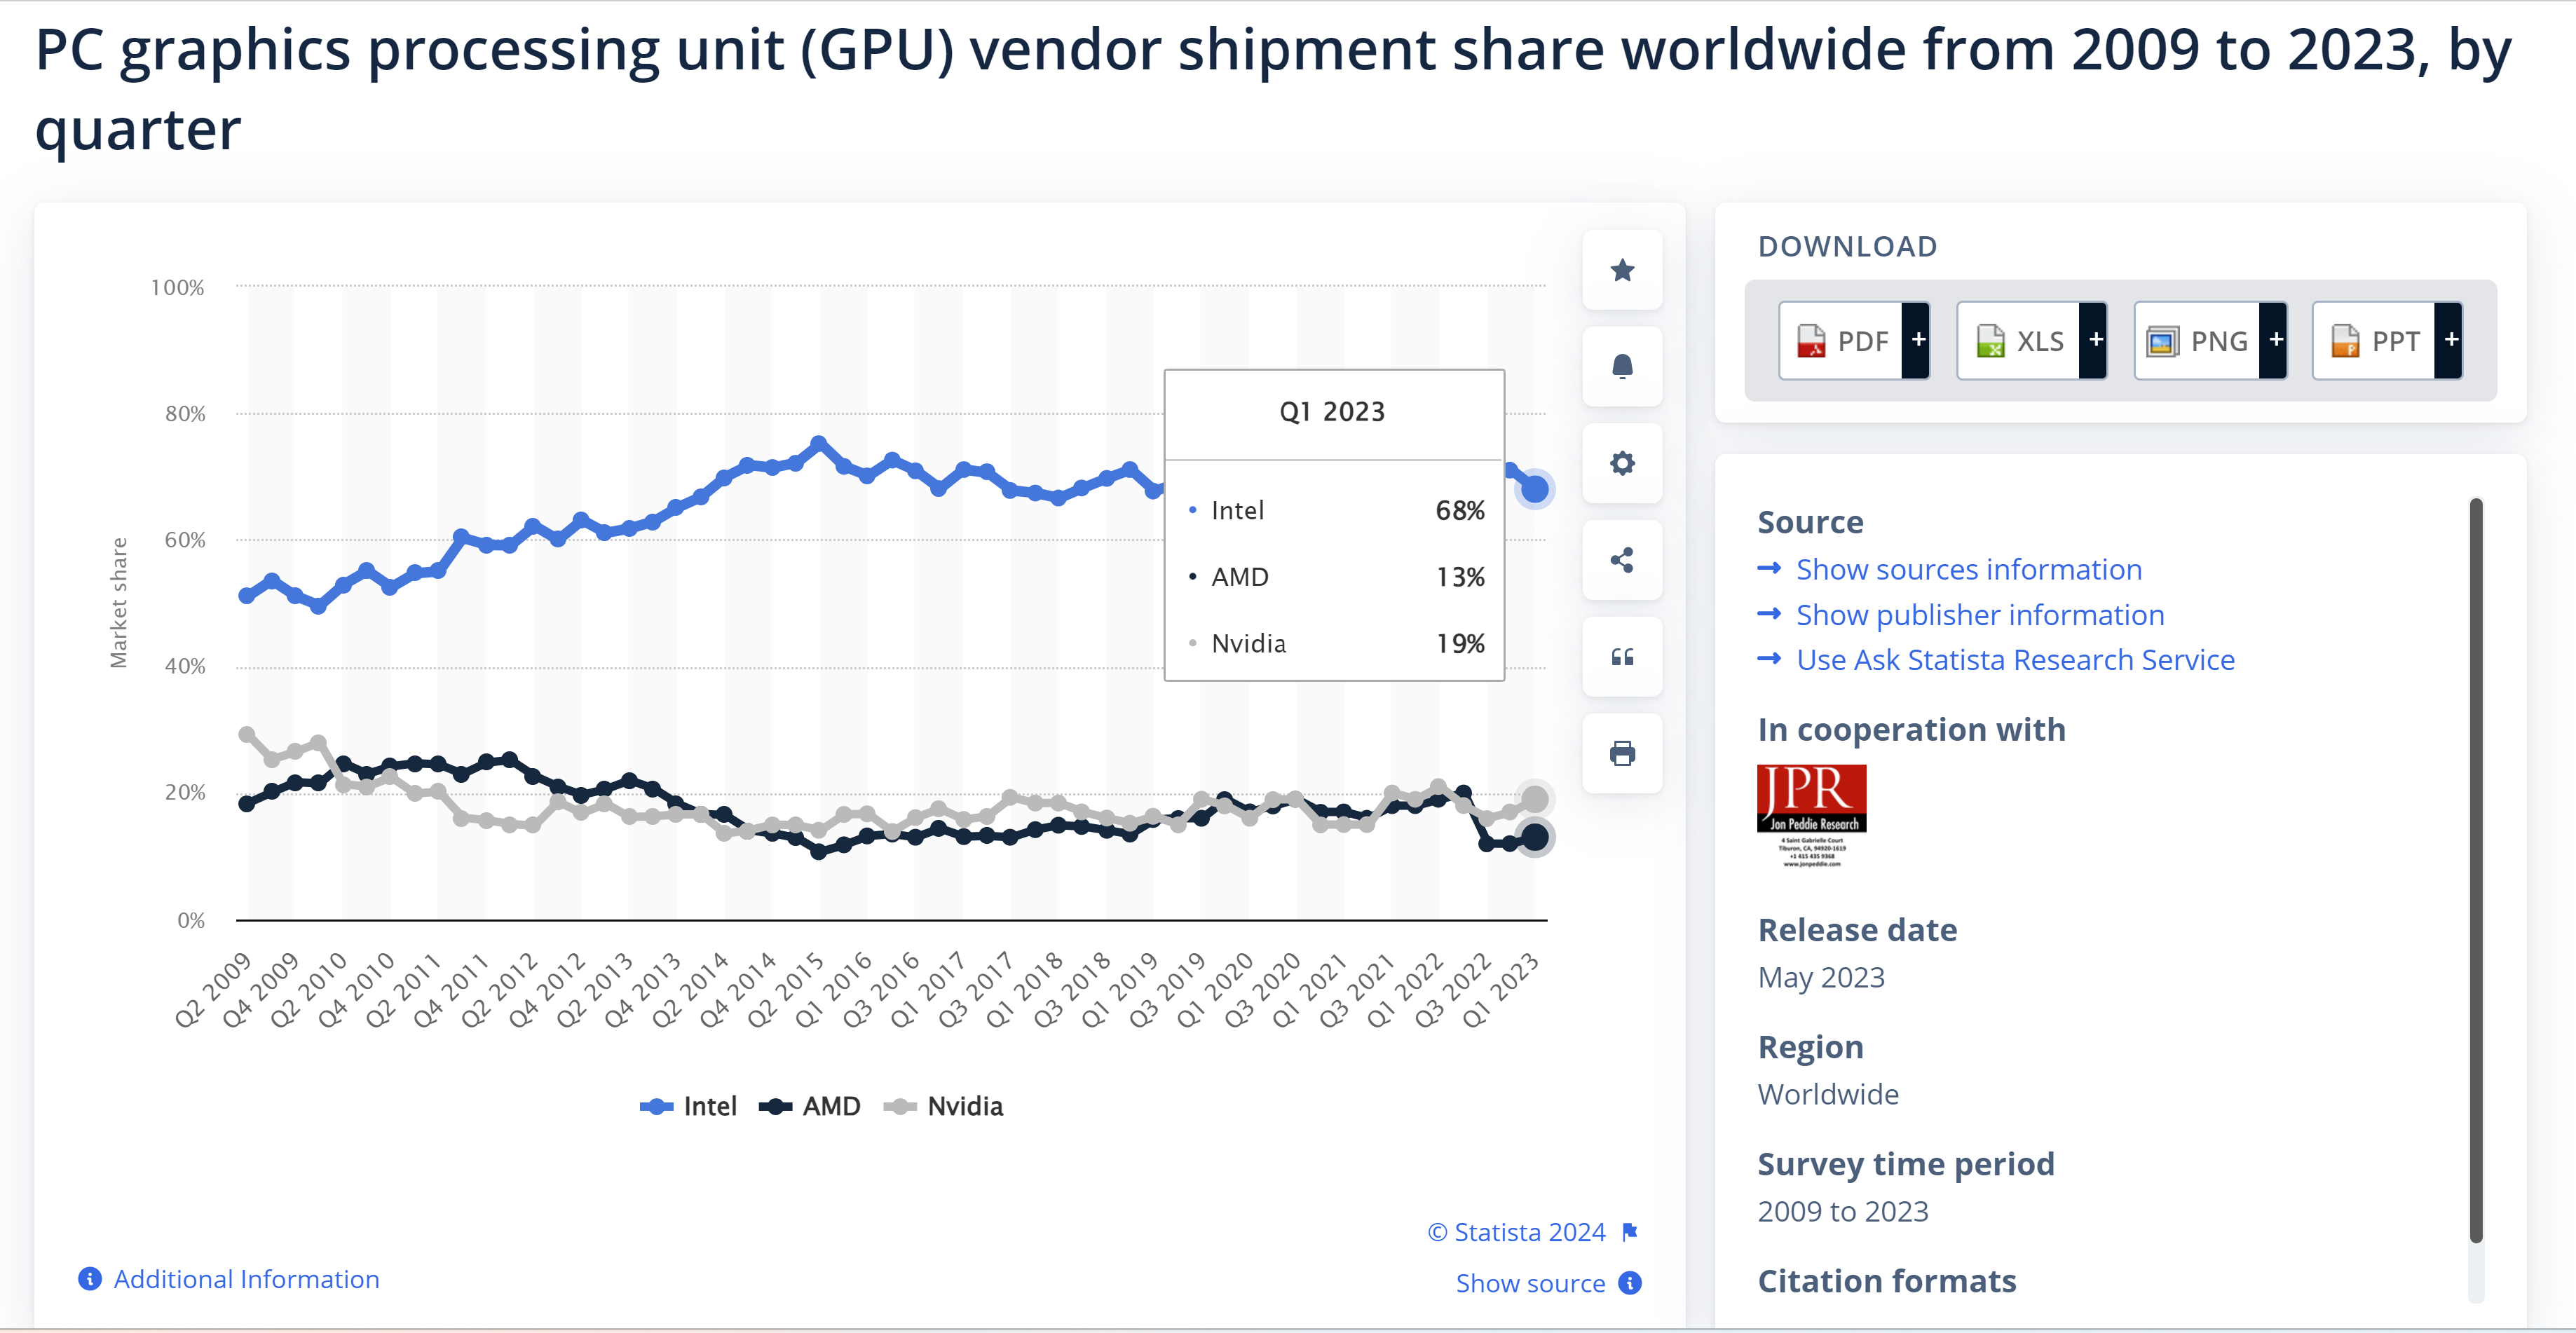
The following graph shows the top GPU providers by market share. If you have read my previous post about TSMC, you can find that the GPU market has much fewer major players, which means they can have more pricing power to earn higher profit margins.
You may notice that Intel has a much larger market share, giving you a good example of the fact that the company should not only strive for market share. Intel has a larger market share, but the stock performance is not comparable to that of AMD and Nvidia because it has less advanced technology, so that a much lower profit margin.
GPU market share
Forecasted Revenue Growth Rate.
To explain how to forecast growth rate, I will use a barber shop in a middle-sized city in Spain as an example. The reason why I chose barber shop and Spain is to reduce the effect of seasonality and other noises in data. Baber shops in big cities will have more customers as the weather becomes warmer and the holiday season is approaching if it is in a location like downtown. So, how will the barber shop grow its business? Initially, the barber shop will acquire customers from the owner’s network referrals, random people passing by, and some marketing efforts like giving out cards. However, after several months, the effect of these basic methods will wane, and the owner needs to find other ways. The owner can try the following methods:
1. Increase the effect of word of mouth.
Word of mouth, in my opinion, is the most crucial role in businesses like barber shops. To make your current customers willing to share your barber, you need to make them enjoy the haircutting experience.
If you are not the barber or the only barber in your shop, you may hire some barbers who are not only good at barbering but also communicating, making customers enjoy the conversation during the service.
As you earn some revenues from early customers, you may purchase a TV in your store and subscribe to La Liga Soccer games if your store is in Spain or the NFL (National Football League) if your store is in America.
You can also have a stereo to play music, but you and the barber should be able to tell whether the customer is enjoying it.
2. Partner with local beauty businesses
You can connect with other popular local beauty businesses but not barber shops. Skincare, fitness, and tattoo businesses usually have royal customers, and those who care about facial and bodybuilding or have tattoos are more likely to care about haircuts.
3. Promotion and loyal program
You can give an offer than average barber shop when you just start or offer loyalty program such as give one haircut for free after three haircuts for a customer. But you need to carefully estimate cost and effect. One bad example is Uber. The ride-sharing company has been offering promotions such as free meals or “20 off for 50” on UberEATS, and $10-dollar monthly subscription to get 5% discount on each ride. But these efforts have not converted to enough additional operating income. In the following part, I will explain how accounting actions contribute to that and the right way to record this expenditure.
All these three methods have two features:
1. You need to spend money(capital) to do them.
2. The money you spent today on these items/services is expected to have an effect for several years rather than just the current year. In fact, some of this expenditure will only turn to increased sales after the current year.
How your business grows will be determined by two factors:
1. Reinvestment rate:
How much money you earned from last year will be put back into investment for next year (on hiring a better barber, or spend money socializing with local beauty business owners, or offering free haircuts for the royal program)
2. Return on capital:
How well you generate a return from the additional investment you made.
In accounting, accountants divide companies’ costs into operating expenses and capital expenditures. When I took accounting classes in college, I learned that operating expenses are the cost companies pay for a current period’s operation (one year or one quarter), while capital expenditures to buy fixed assets such as property, plant, and equipment are money spent today while expect to generate benefit for the business’s long-term operation. However, how accountants record them on the company’s financial statements does not seem to align with what they claim.
The following table shows how accountants and I record companies operating expenses and capital expenditures.
AMD income statement

Words in color: All items that accountants regard as operating expenses.
Words in orange: Items both I and accountants regard as operating expenses.
(If you still remember the Uber case talked about above, the accountants regard all investment in Uber promotion as the “Marketing, general and administrative” operating expenses, while it should be capital expenditure).
Words in green: Items I regard as capital expenditure rather than operating expense.
Words in Blue: Items I regard as one-time expenses and should be added back.
The place to check accountants’ definition of capital expenditure is the Statement of cash flow, as shown below.
The “Purchase of property and equipment” is capital expenditure in accounting terms. Take the barber shop as an example; barber chairs, mirrors, sinks, and backwash units are examples of capital expenditure.
The “Depreciation” refers to the decreased value of your capital expenditure over time. For example, if you bought a barber chair for $300 dollars and expect to use it for five years and cannot resell it. The annual depreciation is $60 dollars (300/5). Depreciation is one of the operating expenses and will reduce the tax that increases the free cash flow you owe, even if it does not give you cash directly.


The following chart shows accounting definition versus my definition of capital expenditure and their effects:
(R&D means research and development investment)
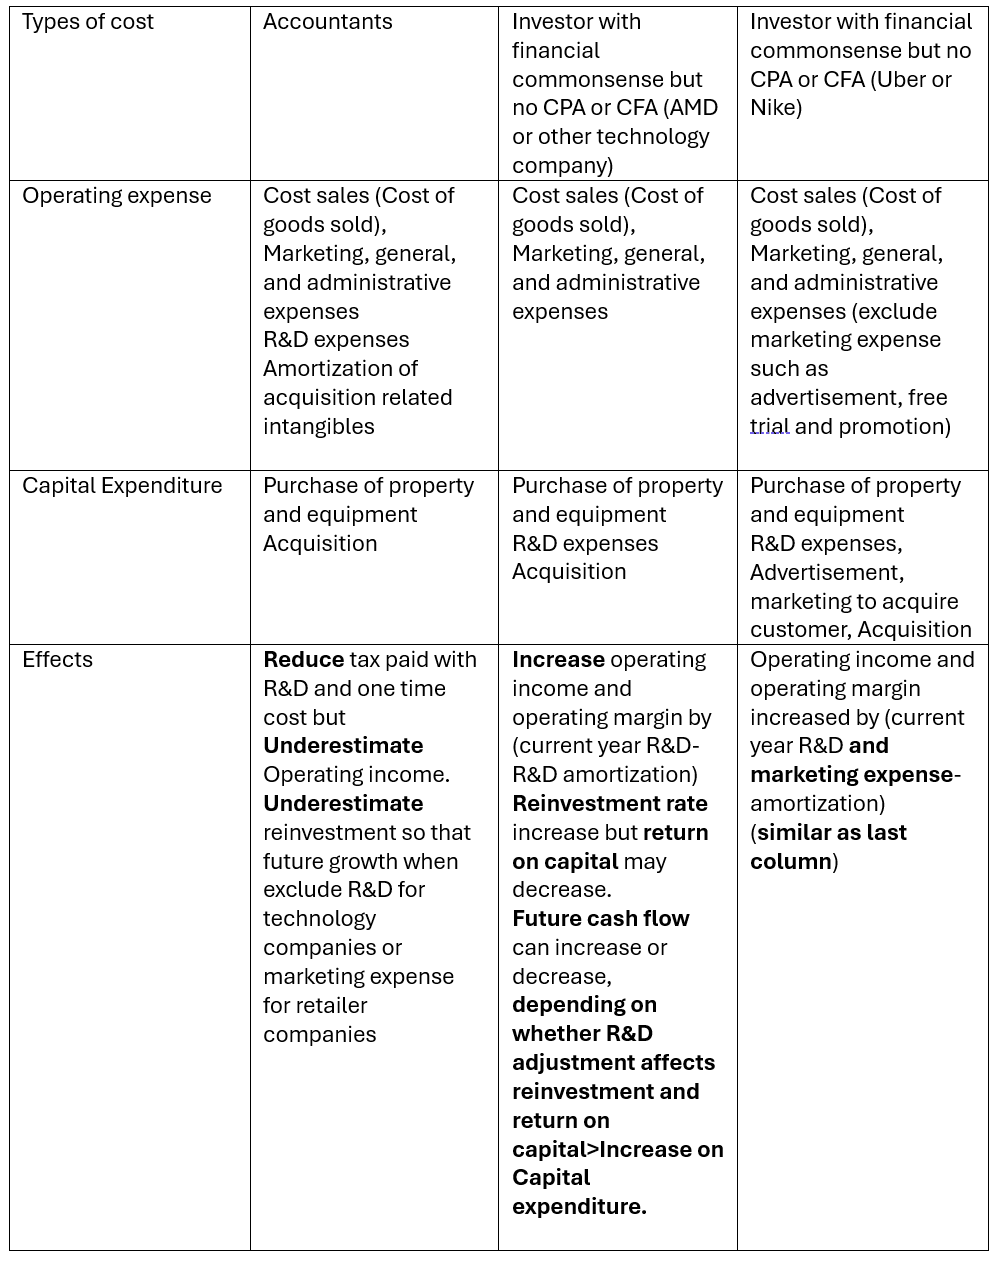
If you see the table above, you can tell that I think a financial analyst with common sense will categorize expenses differently for different companies. I think these are the right actions since companies have different business natures and growth drivers.
Recall that even accountants think that “Capital expenditure is cost to spend today that will generate benefit for many years.”Pharmaceutical companies spending billions in R&D (research and development) to research a medicine will not expect to generate revenues from it this year immediately. Uber does not expect to earn back all the money it spends on free trials or promotions like “buy 50 and get 20 discounts” from a customer within a year. Investment banks spending millions of dollars to train new bankers will not expect them to earn back money by laundering money and manipulating the market for just one year.
All of these are current year/period operating expenses for accountants but are in fact, capital expenditures for investment.
With that being said, we start the reinvestment rate and return on capital calculation by adjusting operating income. The following table shows all reinvestment and the capital AMD put back into the business for future growth, which AMD has made since 2010. The Capex and depreciation are accounting reported capex on the company financial statement. To learn about what NOWC is and how to calculate it, Please search “Net Change of working capital (NOWC)” in my previous post. To learn how to amortize R&D expenses, please search “R&D” in my previous post. (Recommend readers to follow the path of this post first and check that definition later)
Reinvestment adjustment
The reinvestment rate is calculated by the current year's total reinvestment/adjusted operating income. I will explain how to calculate the adjusted operating income later, as you will get bored if I explain now. The following figure shows how AMD made reinvestment over the years and return on capital.
AMD reinvestment

(For the year when a company has a large acquisition like 2020, adding it to the current year will make the reinvestment rate explode, distorting future estimates. I divide the amount by five and add 1/5 of the acquisition cost each year for the next five years, implying that it takes five years for the acquisition effect to reflect on increased revenues and earnings.)
AMD reinvestment rate
(current year total reinvestment/current year adjusted operating income)

AMD ROIC(return on invested capital)

While I think that I am almost done with calculating the reinvestment rate and return on capital, I found one accounting item that forces me to redo the process.

Stock-based compensation.

(Barbershop example for stock compensation)
To explain what stock-based compensation is, let us go back to the barbershop example. You have limited capital, so you cannot pay a high salary for a renowned barber in your city, but you find a young barber who is really good at giving haircuts and communication, but no money-making barber shop hires him because he has few working experiences. So, you tell the barber that you will only buy him meals, pay minimum wages for the first year, and gradually increase his salary based on how much money the barber shop makes. But he will have the right to buy 20% of the barber shop’s ownership for $5,000 after two years if he keeps working here. Having 20% ownership means he will receive 20% of the barber shop's annual income regardless of whether he is working. But if the barbershop is doing poorly and only worth $10,000 after two years, he will not buy 20% ownership for $5000, and his option will become worthless. This kind of protocol may sound too casual to be true for you, but the apprenticeship is one example and has existed in Europe and Asia since the Middle Ages.
However, if the person who gets paid with stock options is also the decision maker for the business, stock option issuing can have more implications. Companies’ executives and managers decide which project the company will invest in. If their primary compensation is in stock options, they have an incentive to take higher-risk projects since stock options are more valuable when the volatility is high (regardless of increase or decrease). Higher risk reducing common stock price is, in fact, beneficial for employee option holders.
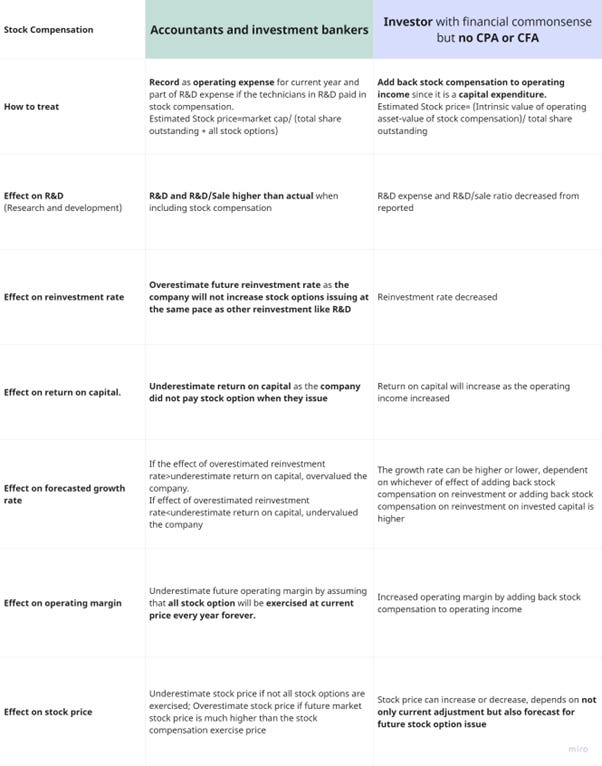
The following table shows the differences I summarized between how accountants, investment banks, and a financial analyst should treat stock compensation, and effect.
Based on the accountants’ and investment bankers’ treatment of stock compensation and its features, two necessary adjustments are needed in the stock valuation.
1. Adjust growth and operating margin numbers with stock compensation.
2. Forecast the company’s future stock compensation and its cost.
Stock-based compensation adjustments.
Reinvestment
In the following table, I calculated the adjusted R&D expense by excluding the stock compensation.
Notice!! I am not disregarding stock compensation as future reinvestment, but I will estimate them separately. If I include them in R&D, the employee stock compensation will keep rising forever (because I use R&D/Sale to forecast future R&D investment), while the truth is that the company will reduce stock compensation issuing as it becomes larger and older.
As you can see from the figure below, the adjusted R&D expenses/sale changed few before 2016, but the employee stock compensation contributes to about 2%-4% sales in R&D investment. The percentage is increasing as the company is growing.
Adjusted AMD R&D expense to sale revenue.

Adjusted Operating income and margin.
The table below shows three types of income margin, and we will always use the operating profit margin if we are valuing the free cash flow to the firm, while use the net profit margin if we are valuing the free cash flow to the equity. (Equity=Firm Value-Debt).

Since we use forecasted operating profit margin and forecasted revenues to estimate the company’s future operating income, we need to exclude the stock compensation from the operating profit margin. Otherwise, we will imply that the company will issue the same amount of stock compensations forever, regardless of whether the company is growing or declining.

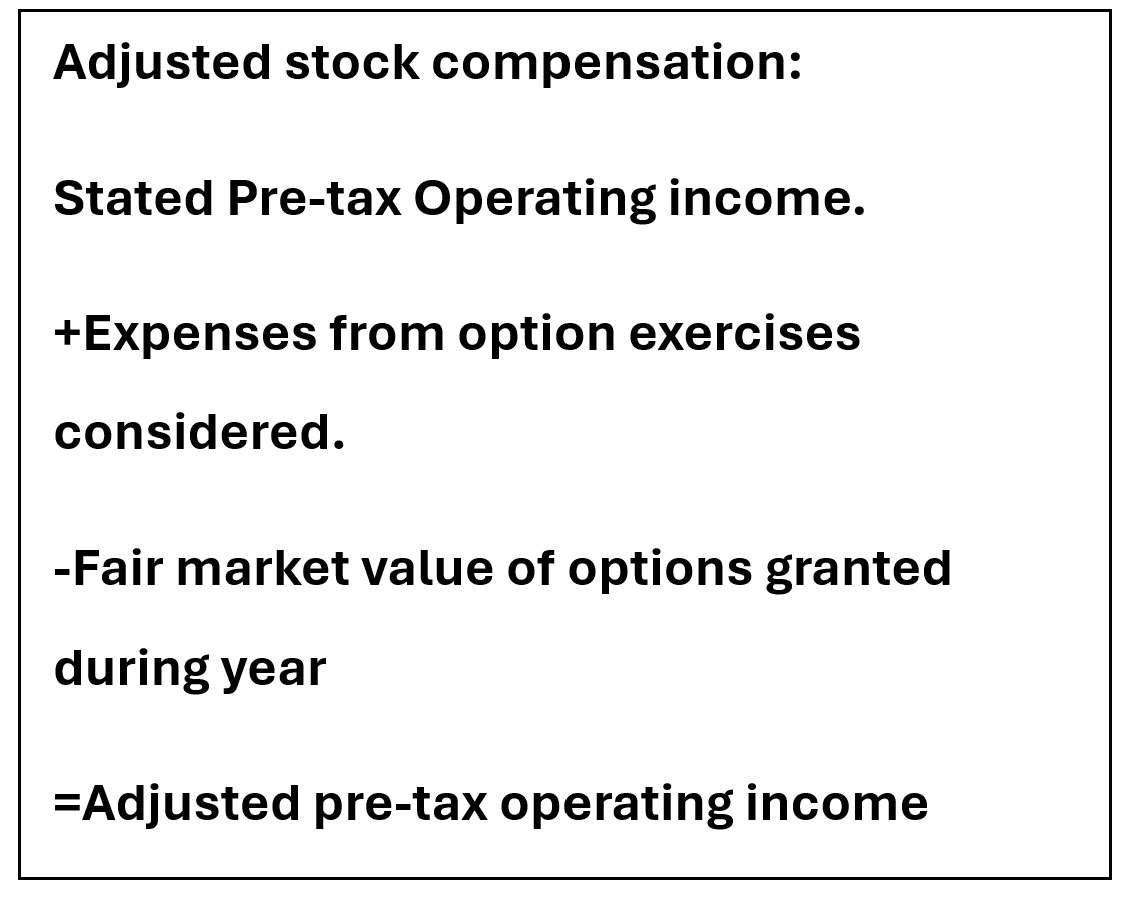
Steps to adjust operating income with accountants’ expensing stock options.
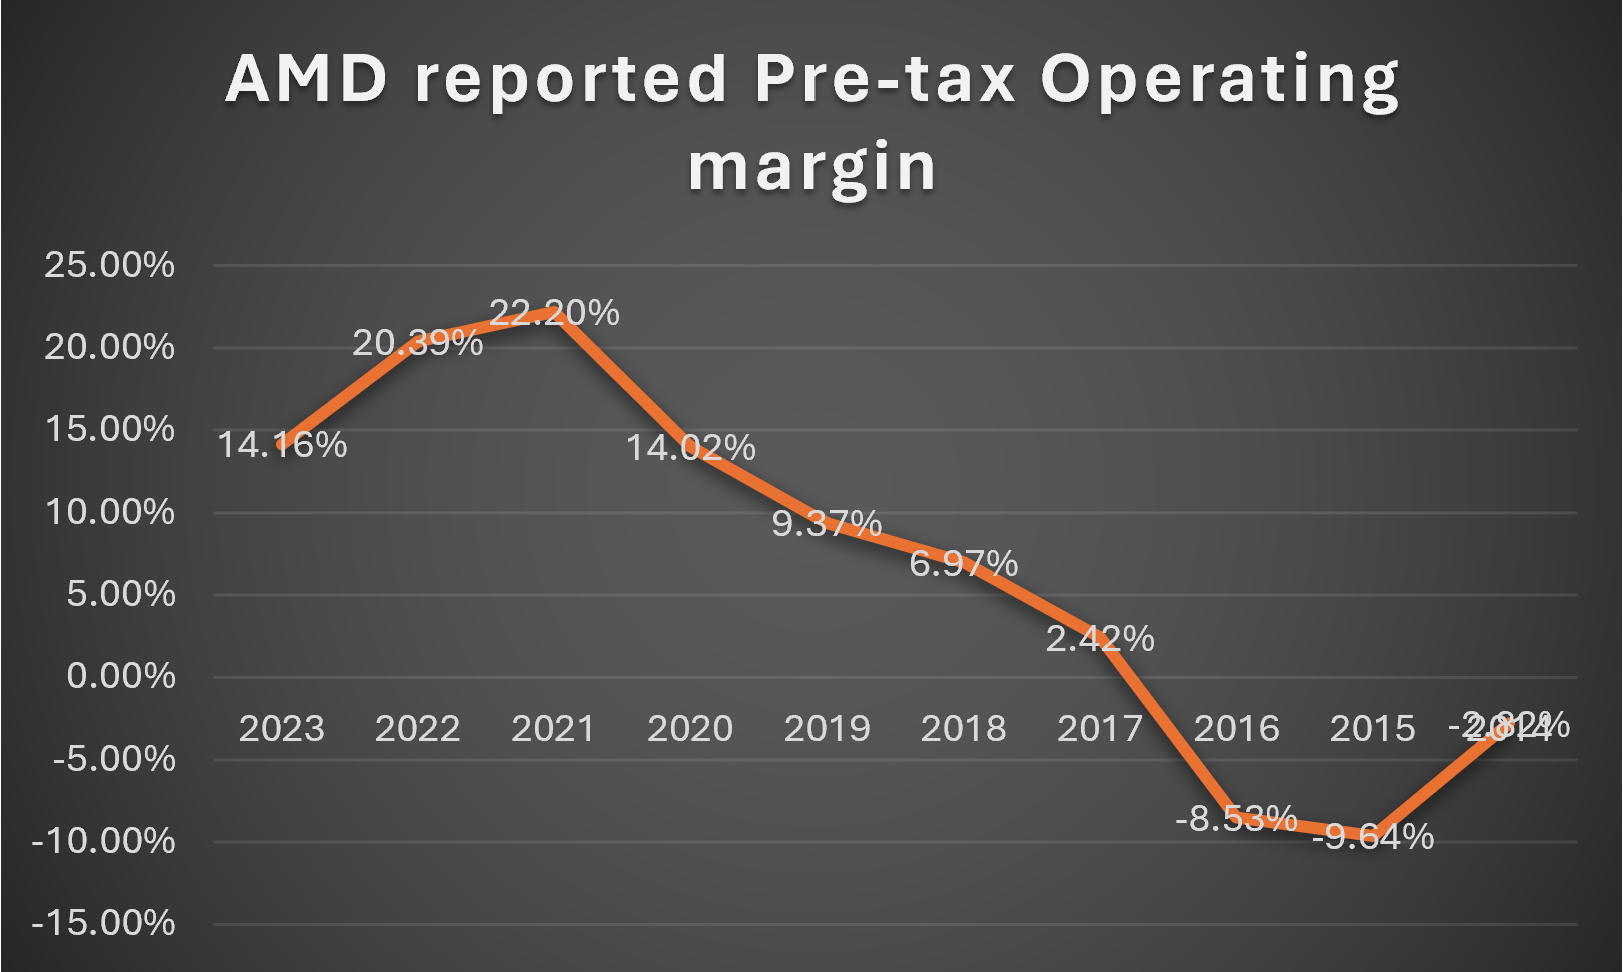
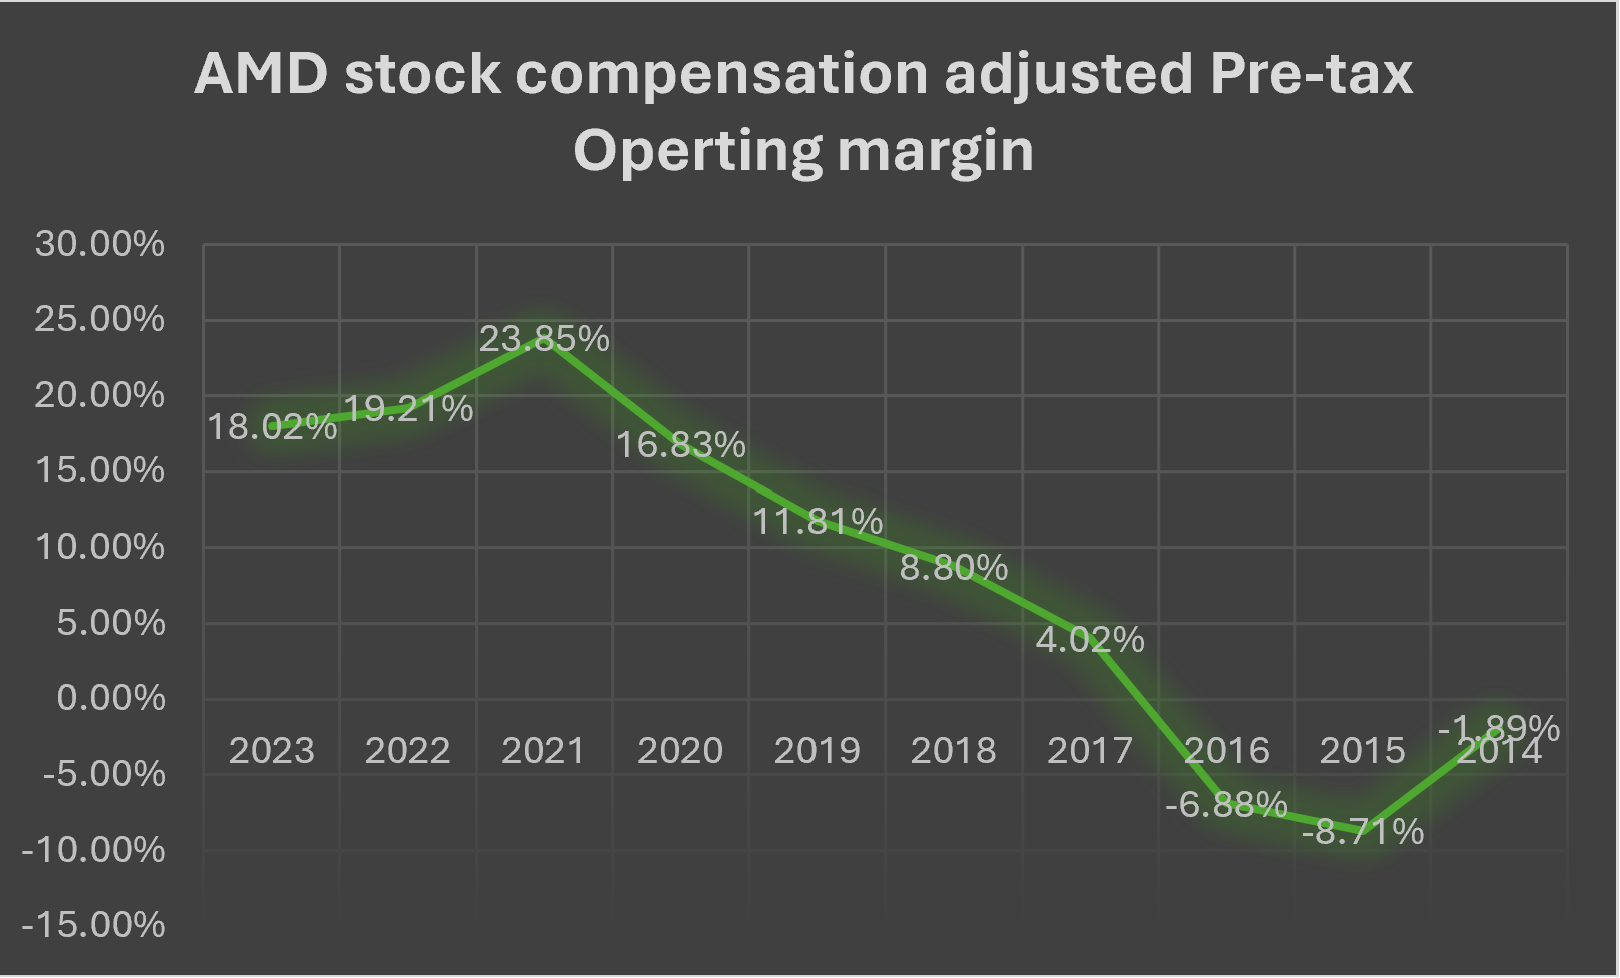
AMD stock compensation adjusted pre-tax operating margin.
The following graphs show differences between AMD's pre-tax operating margin with and without taking stock compensation as an expense. While the stock compensation expense seems trivial and excluding it only improved about 2% operating margin in the past ten years, the AMD pre-tax operating margin increased by 4% in 2023 by excluding stock compensation expense. Considering that the company will keep issuing more employee stock compensation as it grows and reduce stock compensation as it matures after 3-5 years, using the historical operating margin or industry average, as investment bankers usually do, will fail to grab these changes.
Estimating future stock-based compensation
Then, the next question is how to forecast the company’s future stock compensation issuing.
Two challenges are embedded in estimating future stock compensation.
1. How much the future market stock price will be, and how much the exercise price (the price the employee has the right to buy) will the company set?
Back to the barber shop example, we need to know how much the barber shop’s future market value is and how much the barber shop owner will offer the employee to buy 20% of his barbershop.
However, since our goal is to estimate the future market value of the whole company (barber shop in the example), the process becomes circular and iterative.
2. How much percentage of the company’s ownership would like to give up in the future to attract and retain employees?
A company is likely to give the employees a large portion of its future ownership as it starts up and grows but will provide less and less as the company expands.
To answer that question, let us return to the growth rate formula I mentioned at the beginning of this part.
Growth rate=Reinvestment rate * Return on capital
Reinvestment rate:
How much money you earned from last year will be put back into investment for next year (on hiring a better barber, spending money socializing with a local beauty business owner, or offering free haircuts for the royal program)
Return on capital:
How well does the company generate a return from its additional investment?
By estimating the company’s future growth rate, we can estimate the reinvestment rate.
The EBIT (before tax operating income) *reinvestment rate is how much annual operating income the company will put back into business in numbers.
The graph titled AMD reinvestment above shows the reinvestment includes:
-Capital expenditure les depreciation
-R&D less amortization
-NOWC
-Acquisition
We can estimate total future reinvestment in numbers, estimated future capex, R&D, NOWC, and acquisition based on Capex/Sales, R&D/Sale ratio, etc., and forecasted sales revenue, and subtract these items from total reinvestment to get the estimated value of stock-based compensation.
Estimating Future Stock Compensation

By doing so, we solved the problem of estimating the value of stock-based compensation without the need to estimate future stock price and exercise price. The logic is if the company plans to spend $1.5 billion for a year and have $1 billion on Capex, R&D, NOWC and Acquisition, we expect the rest of the $0.5 million will be from stock-based compensation.
Because we use forecasted growth rate and profit margin to estimate future revenue so that operating income and net out all capital expenditure (as the free cash flow chart shown below), we don’t need to worry too much if we underestimate or overestimate future stock compensation a little bit. Higher stock compensation increased forecasted reinvestment, increasing expected revenue growth and operating income, but also increased expected total netting out capital expenditure.

While we did not value the market value of stock compensation, we estimated how much the company and the employee think the stock compensation is worth. Suppose a soft engineer’s salary at AMD is around $300k annually. If the company paid the employee $250k in cash and some stock options, we would say that both AMD and the engineer have an implicit consensus that the stock option granted is worth $50k.
You may wonder, “But the company and employee can be wrong about the market value of the stock option in the future?” That is true. However, I can check the company’s previous stock options and exercise prices to estimate how many shares and exercise prices the company usually sets. This will help estimate how many shares and exercise prices the company will set for future stock options. Once I estimate these numbers, I can estimate the market value of these stock-based compensation. I will explain in more detail later, but let us start estimating the growth rate first.
Decide the number for growth rate.
The following graph shows AMD’s reinvestment rate (how much % of operating income is put back into the business) and return on invested capital(how well the company generated return from invested capital. As we can see, AMD’s return on capital has been volatile despite being high.
Attention!!: While I excluded stock compensation in the operating margin calculation earlier and will separate them when forecasting future reinvestment rate, ROC, and growth rate, I counted the stock compensation that has been included by the company’s accountants in R&D investment when I calculated the previous reinvestment rate and ROC. Because AMD does pay them as compensation to its employees, excluding them will underestimate the reinvestment rate and overestimate the return on capital. While for future reinvestment rate estimates, I need to make my own judgment about the value of future stock compensations.
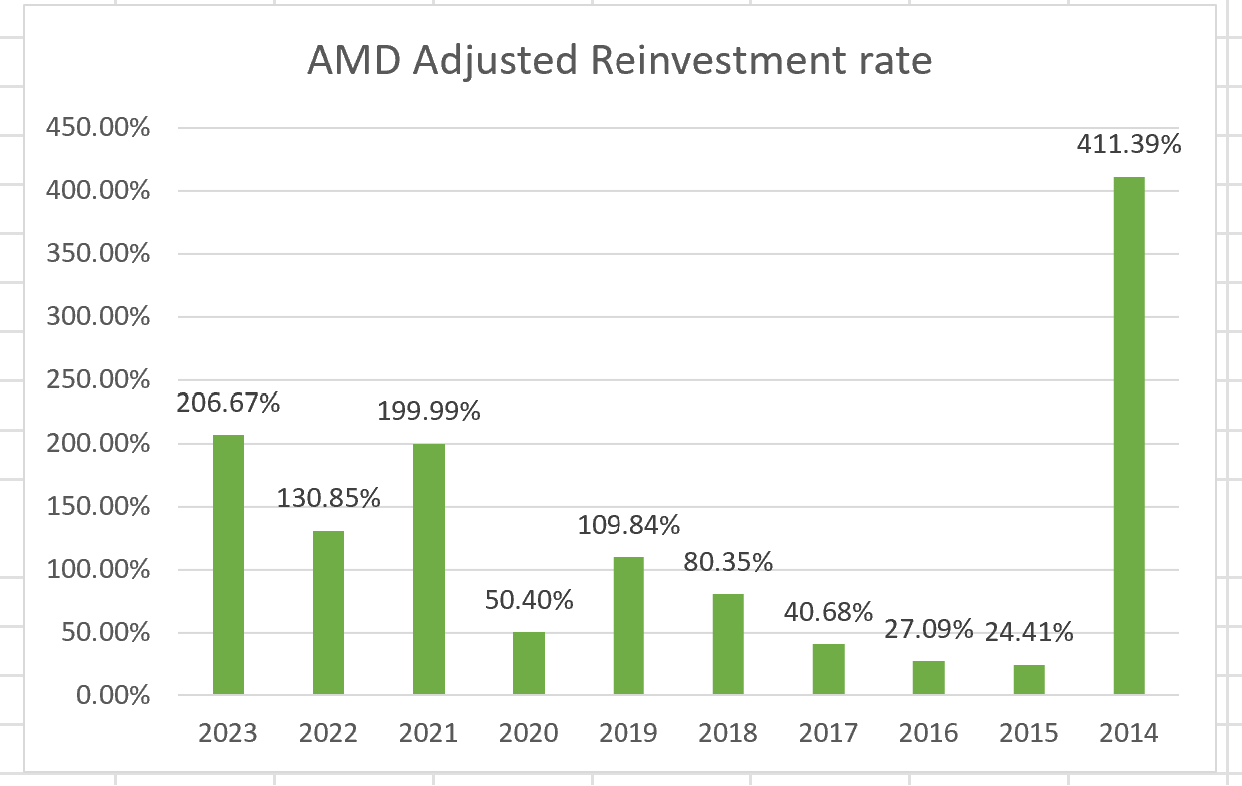

However, I have consistently stressed in investment or life that the past does not predict the future. But it does give us some clues. At least a company with years of high returns has a higher possibility of generating higher returns in the future. However, I need to make my own judgment about how well and how long the company can maintain high growth.
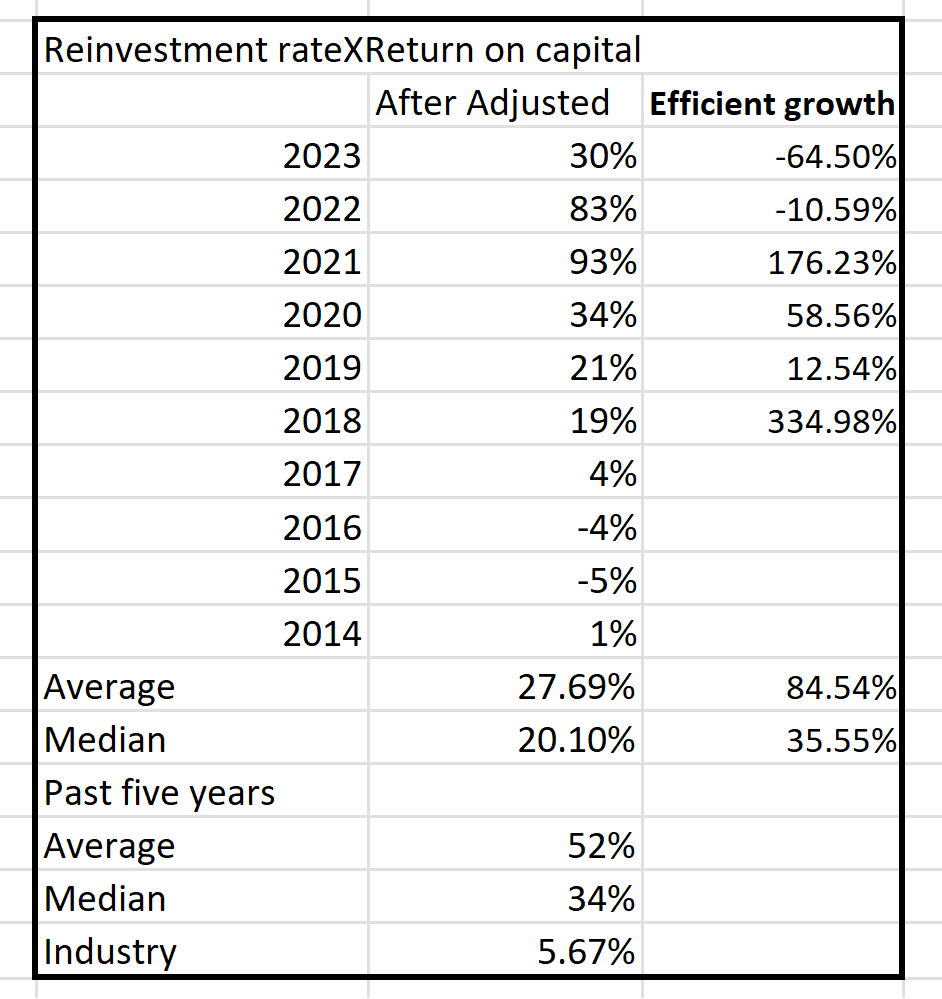
So, I calculated the “efficient growth” to see how well the company scaled up its return. For example, if a company's revenue grows 15% in year 1 and 20% in year 2, the efficient growth rate is 20%/15%-1=33.33%. If the company has been doing that for five years, we can use the current year's revenue growth*(1+33.33%) as next year's growth rate.
AMD efficient growth
But there would be two counterarguments for such action.
1. The efficient growth rate for companies like AMD shown above is very volatile, ranging from 334% to -64.5%
2. No company can maintain efficiency forever.
Both arguments are legit, but there is a solution.
I will estimate how many years the company can maintain high growth and gradually reduce the return on capital. So when I got 35.55% as AMD's median efficient growth rate, as the picture shows, and I estimate the company has 3-year exponential growth, I will make:
Year 2 revenue growth=year 1*(1+35.55%),
Year 3 revenue growth=year 1*(1+35.55%)
Then, gradually reduce the growth rate to the industry average.
While a company can have an extraordinary or terrible year, the law of large numbers in statistics mitigates the differences. You may not heard “the law of large numbers,” but that is ok. Think about that. A company may have a good year in 2024, a bad year in 2026, or a good year in 2026 but a bad year in 2017. While no one knows which specific year is good or bad, there are a few differences between when it happens in 2025 and 2029.
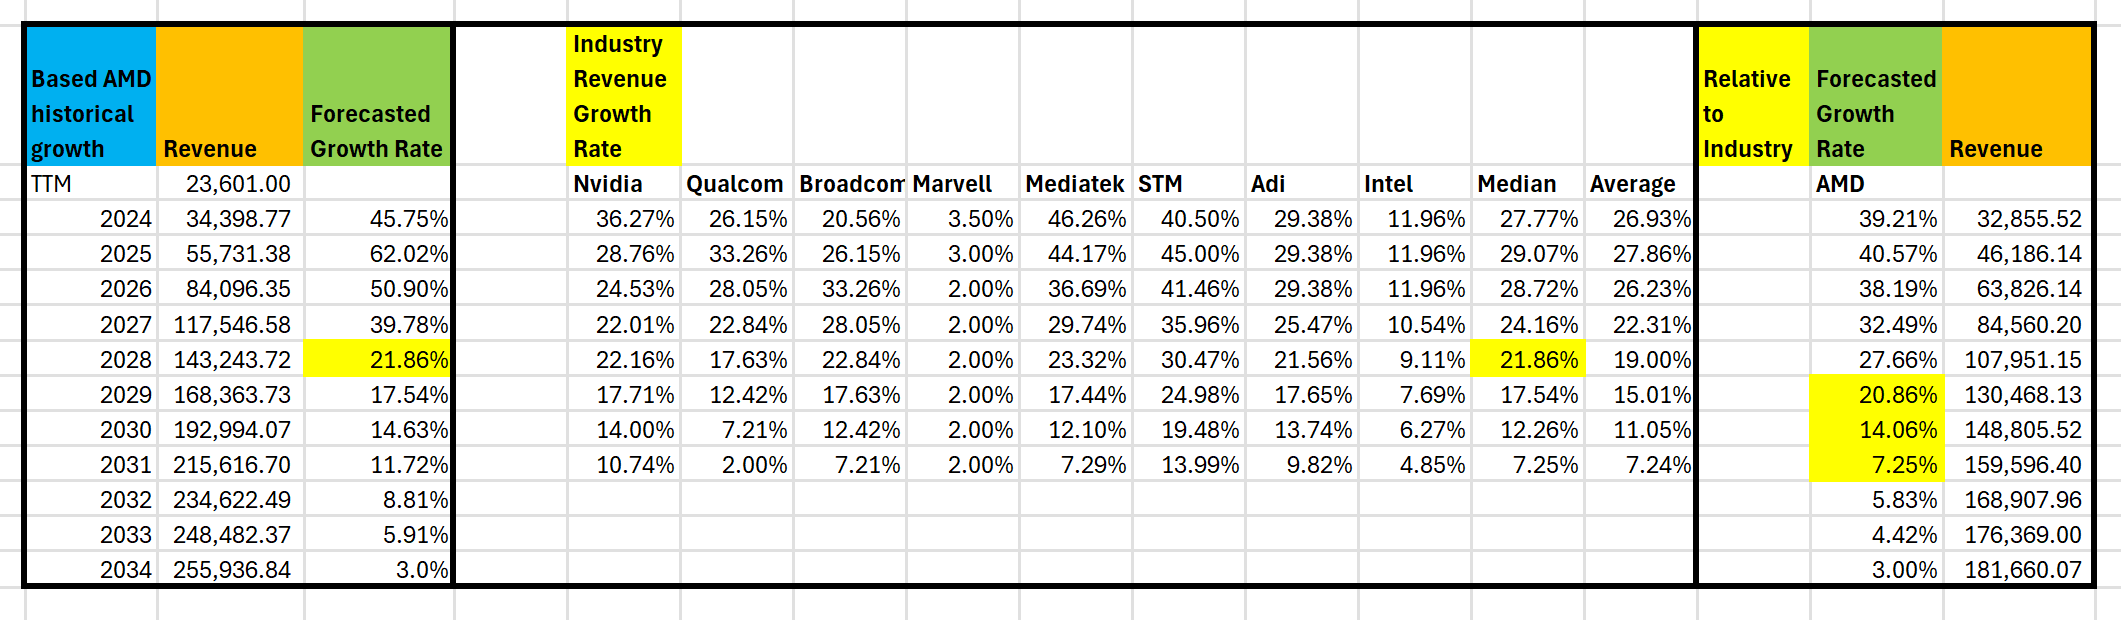
My first reaction when I see the forecasted AMD revenue growth rate below is:
**Are they too high to be true?

To see whether the number is too high, I compare the estimate with the industry average. While using industry average numbers like investment bankers or equity analysts will miss star companies or overestimate declining companies, it does give us some ballpark. By comparing it to the industry average, I am implying how low AMD's growth rate can be if it is as mediocre as other semiconductor companies. (I did the same process by calculating ROIC(return on invested capital) and reinvestment for each company in the Figure below in my TSMC stock valuation. So I have these data on hand). Many like to say, “Buying stock is too risky because it can go very high and also go to zero.” Some say, “Everything is possible, and you will never know.” I have found that these liberal thoughts like“You will never know” are detrimental in finance or decision-making. Uncertainty is a feature of life rather than an exception. If uncertainty is the reason that prevents you from making decisions, then you cannot finish most of the work and enjoy most of the activities in your life. Because the industry average I calculated has the sample including high-growth companies like Nvidia and consistently underperforming companies like Intel, so it gives me some ballpark. However, to make that work, you can only do a fundamental analysis(how much free cash flow the company will have if it runs for 10-20 years). In the short term, the price will be up and down because traders and investment bankers only care about next year's or next quarter's results.
As the picture shows, my forecasted AMD revenue growth rate is much higher than the industry average, but that is expected. And remember that AMD, Nvidia, and Intel are the major three graphic design semiconductor companies. I set AMD’s year five growth rate the same as the 21.86% industry median and gradually reduced the 62.02% revenue growth rate to that number after two years of efficient growth. (Just use 62.02%-(62.02%-21.86%)/5 for 2025, then subtract (62.02%-21.86%%)/5 from the 2025 rate for 2026, etc). However, I am still concerned about overestimation as my forecasted AMD revenue growth rate has almost doubled as that of Nvidia, one of the industry's most successful companies.
AMD forecasted revenue growth rate vs Industry


If I know how well AMD performs relative to other semiconductor companies, I can estimate the AMD growth rate based on the industry growth rate.
AMD growth relative to the industry

It sounds complicated but easy to do. I just use the AMD revenue growth rate to divide the revenue growth rate for each major semiconductor company during the same year. So, as the picture shows above, 71.02% in 2022 means AMD’s revenue growth rate is about 70% of Nvidia, while 129.58% in 2021 means AMD’s revenue growth rate is 129.58% of Nvidia growth rate. AMD outperformed other companies for some years (if the ratio is over 100%) and underperformed for some years (if the ratio is under 100%), but as I collected over 60 samples(10 years for seven companies), I roughly know how well AMD outperform the industry. Some companies have had a negative growth rate for a year, making the ratio not meaningful anymore, so I excluded those numbers and got a median 145.62% ratio. It looks very high, but I am implying that AMD will outperform the industry average revenue growth rate by 145.62%. So if the industry average growth is 20%, I expect AMD growth 20%*145%=29%.
As you can see, the AMD revenue growth rate starts higher than everyone else in the industry but gradually becomes close to Nvidia and the industry average. But if I multiply the industry median average by a 145.62% relative ratio every year, I will imply that AMD will outperform the industry forever, while in reality, every star company will lose its competitive advantage over time. You don’t believe? Take a look at Intel's growth rate. It will consistently underperform the industry. But don’t forget that Intel had been one of the most high growth companies during the late 90s to 2000 dotcom boom.
AMD Forecasted Growth rate based on its own efficiency vs. relative to the industry

Now the question is, should I use the Revenue Growth rate based on AMD's historical growth(higher) or AMD's performance relative to the industry(lower)? I don’t have to set the stock price to a specific number. I can put it to a range. And I don’t have to buy all AMD shares at once. I can do that because stock prices themselves are in a range. The stock price will not increase or decrease exactly by 10% if a company’s net income increases or decreases by 10%. The market usually overreacts to both good news and bad news, and you just need to sell when everyone wants to buy and buy when everyone wants to sell, as long as you estimate the fair value.
Come back to the future stock compensation estimation
Now, I have estimated AMD’s future revenue growth rate so that I can estimate stock compensation with the following steps:

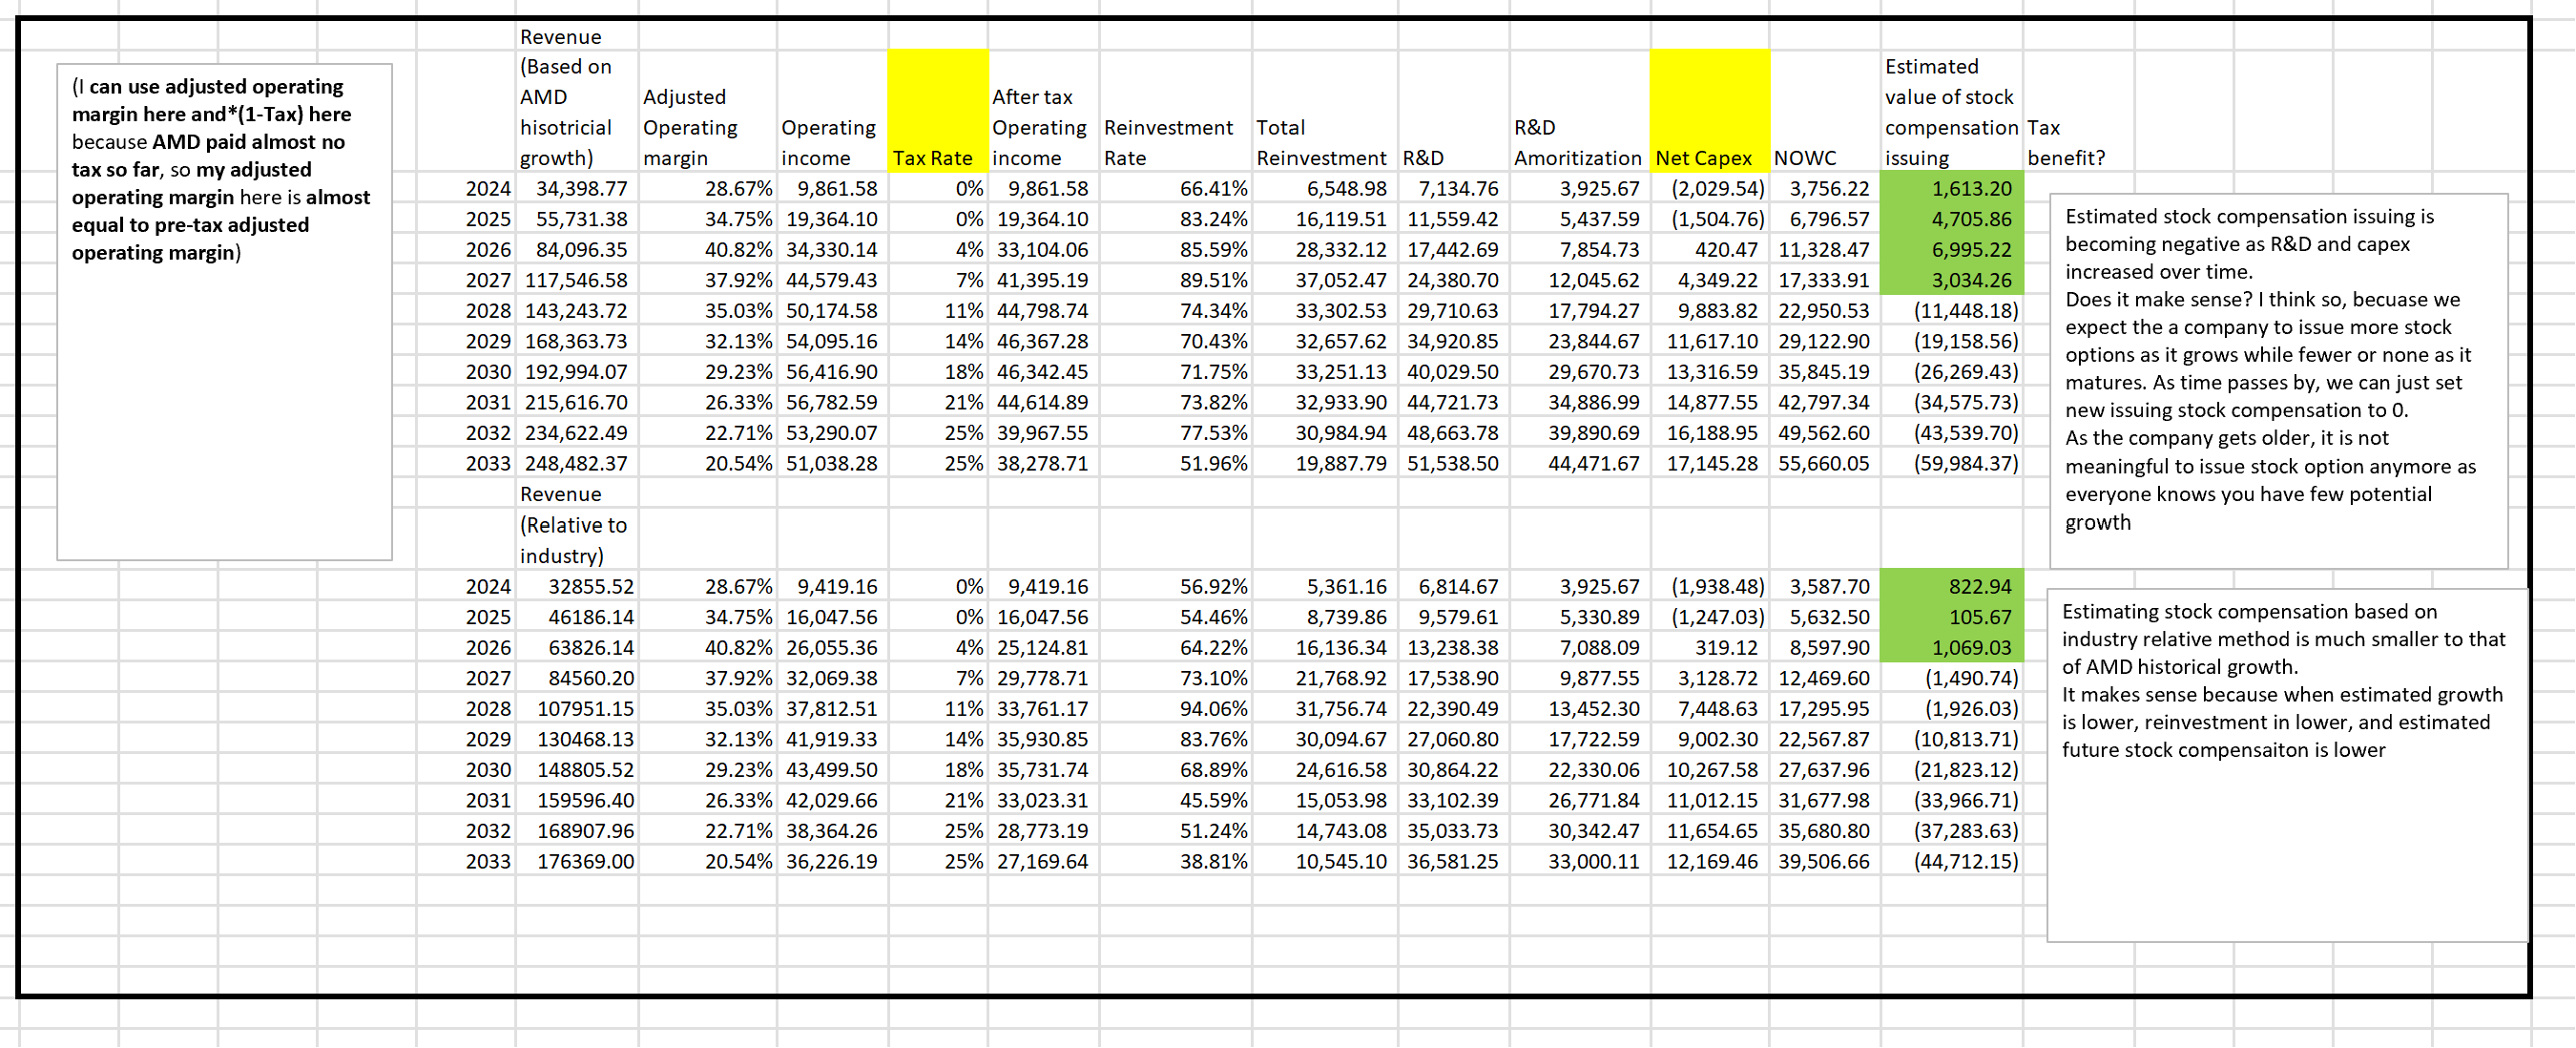
The following figure shows my estimated AMD’s future stock compensation issuing using the forecasted AMD growth rate based on its historical growth and the forecasted AMD growth rate based on its performance relative to the industry.
AMD estimated future stock compensation

You will notice that the estimated future stock compensation is negative after year 4 or 5 because I expect the company reinvestment rate will grow as the company grows while gradually decreasing as it becomes mature. Since the company will keep spending on things like capital expenditure on offices, factories, etc., the estimated stock compensation number becomes negative when you just mechanically subtract other reinvestment from total reinvestment. But don’t panic. I can just set all negative estimated stock compensation to 0, implying that the company will issue fewer and fewer and none stock options as it becomes older.
Why is that? A growing company uses stock options to attract talent, and the stock option has value since the company has the potential for future growth. For mature companies, neither does the company need to attract more talent nor has considerable growth potential.
You will also notice that the estimated future stock compensation when using the forecasted AMD growth rate based on its historical growth is much higher than the forecasted AMD growth rate based on its performance relative to the industry. These differences are also as expected. More growth needs more reinvestment, and more reinvestment needs more stock compensation. So, next time you see analysts, give a company a 50% growth forecast every year for the next ten years for companies like Tesla, OpenAI, Roblox, etc. Your reply to them should be, “It is ok, as long as you show me the corresponding reinvestment.” If a company has a 30% return on capital and an analyst tells you it will have 50% growth for ten years, he or she implies that the company needs to reinvest 166%(50%/30%) of its operating income annually. In the rare case that the proposed company can reinvest that much yearly, the money must come from either more debt or stock issues, or both. So, the revenue will increase, but the capex subtracted from the FCF and debt subtracted from the operating asset will also increase, and the total stock shares outstanding will also increase. Whether the stock price will go up or down depends on which effect is larger. And don’t forget that the return on capital will also decrease over time.
AMD forecasted free cash flow
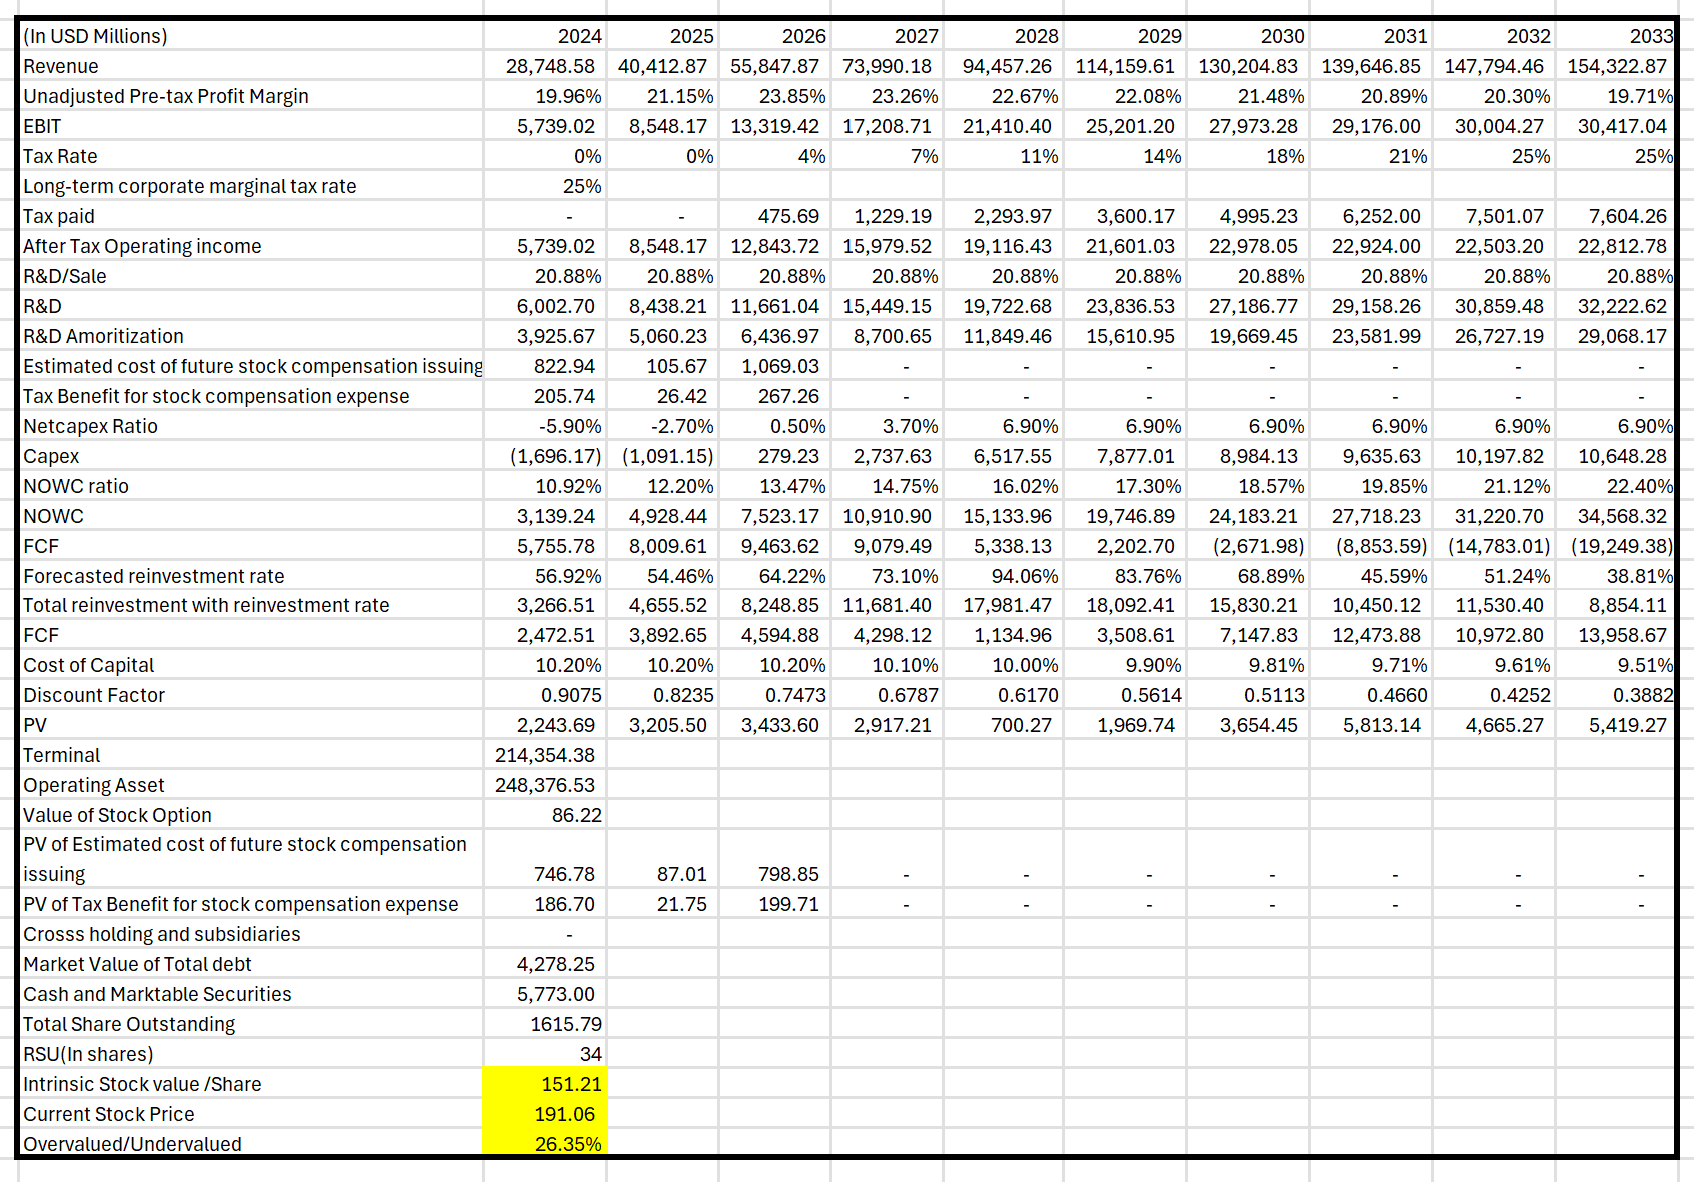
With the information and analysis above, I forecasted AMD's future free cash flow and intrinsic stock price (How much it is worth) as shown below on March 14, 2024 (before the market opens).
Several things to notice:
1. You will find that the original FCF shows a negative number. You will also encounter a similar issue when you estimate FCF with R&D/Sale, NOWC/Sale, and Capex/Sale ratio. These situations usually happen when the company has a small NOWC/Sale or R&D sale ratio when you value the company, but will explode if you gradually increase it to the industry average. For example, using a 10.92% NOWC/Sale rate for 2024 only costs the company $3.7 billion on NOWC but will be $55 billion in year 10. So, I subtract the total reinvestment based on my estimated rate. By doing so, I have been consistent since the reinvestment has been tied to the growth rate.
2. If you compare the stock price using the forecasted AMD growth rate based on its historical growth(high) and the forecasted AMD growth rate based on its performance relative to the industry. You will find that the stock prices only have about 5% differences, even if the growth rate is much higher when you use the forecasted AMD growth rate based on its historical growth(high). This is the advantage of using free cash flow analysis by discounting future cash flow to day versus traders’ pricing. The power of discounting makes the differences few. To understand the meaning and definition of discounting, imagine that you want to know how much you need to save today if you're going to withdraw 10k dollars after year 10 with a 3% annual interest rate versus if you want to withdraw 13k.
It costs you about $7400k today to receive $10k after year 10, while it costs about $9600k to receive $13k after year 10. (Although saving money in the bank is a terrible investment as the interest rate they set rarely beats the inflation rate. But I just use the bank as an example).
AMD Free Cash Flow (based on its historical growth)

AMD Free Cash Flow (based on AMD relative to the industry average)

3. The discount factor. (Important!!)
Discounting in finance refers to calculating how much the money in the future is worth today. You can understand by common sense that $1000 today is worth more than $1000 10 years from now for two reasons:
a. You can invest $1000 today to generate more money over the next ten years.
b. The $1000 dollars after ten years has less purchase power than today due to inflation.
Let's go back to the barbershop to understand the discount rate. Suppose the owner takes an 8% annual interest rate loan to run the business. If the loan is the only source of capital to run the business, then the barber shop should at least have an 8% return rate to break even because its free cash flow next year is only worth FCF/ (1+8%) today, and its free cash flow in year three only worth FCF/(1+8%)^2 today. However, if a company raises capital from a loan and equity by going public, the discount rate will be the weighted average of the cost of the loan and the cost of raising capital from the stock market. While the company is not obligated to pay its stockholders, it is expected to generate a return relative to the overall equity market risk and the company’s specific risk. For example, the long-term average return for US SP500 is about 10%. If a company has a 3% annual return over time and the investors see no higher growth in the future, they will sell the stock, pushing down the stock price.
To see how influential the discount rate is, check the price I calculated on 3/14 and updated on 3/15 when I found a typo I made in estimating the discount rate. All other data are the same except the discount rate to increase from 10.13% to 10.2% (only a 0.07% difference),
But the intrinsic value decreased from $208.61 to 182.46 (13% difference).”
In contrast, the revenue forecasted differences in point 2 (search
“If you compare the stock price using…” above only causes 5% of stock price differences. Investment bankers and analysts spend so much time and money forecasting earnings and revenue for next year or even next quarter, but their significance cannot compare with forecasting future risk and discount rates. I pointed out that because I also used to spend much more time estimating future growth but didn’t spend enough time on discount rates as well.
To learn more about how to estimate discount rates, please read my previous post1 and post2. I made a serious mistake in the post 1 and corrected it in post 2. But it is a very representative mistake that I think will be helpful for you to check. I didn’t explain how to estimate the discount rate again here because if I do so, I will be like teaching you letters again whenever I teach you new vocabulary. Instead, I prefer to explain more important concepts for different companies. For companies like AMD, estimating the growth rate is more important. In contrast, for companies in countries like Turkey or Argentina, the discount rate will be the key driver since those countries have unexpected long-term inflation rates.
AMD Free Cash Flow (based on its historical growth) (3/14/2024 before market open)
(The image is blurry as I took it with the cellphone to keep a record. I am in a rush to do it before the market opens so that my valuation is not affected by the psychological effect)
AMD Free Cash Flow (based on its historical growth) (3/14/2024 after market close)

US-China political risk
Another concern for investing in semiconductor companies like AMD is the future political conflict between the US and China and the corresponding tariff or trade ban. My understanding and impression of the US and Western countries’ attitudes is that China or other developing countries or immigrants are like public toilets for travelers. They run to it when in need, and they think it is gross when they don’t need it. If you look back at history, you may find that such opposition and conflict always existed, ranging from the Roman Empire versus the Ottoman Empire to the US versus the Soviet Union during the Second World War and the Cold War to the US versus Japan and China after the second world war. Interestingly, some groups in the Roman Empire collaborated and even depended on Ottoman Sudan; the Soviet Union and Germany conspired to carve up Poland; Japanese Americans were detained in the US during World War II(although the Japanese do not attribute any current failures to their unrelated ancestor like some people), but they get along with the US after the world war II; Western countries ban Russia oil and gas after its invasion to Ukraine, but they bought from India who bought cheap oil from Russia. Even during the most hostile environment, trade between countries rarely wholly stops. If uncertainty is why you don’t invest, chances are you will never start.
During each of these periods, the opposite power usually competes sometimes and cooperates with each other sometimes. So, I regard these risks more like a continuous risk (the US is either a little bit more friendly or more aggressive to developing countries) than a discrete risk (the US either completely bans products from these countries or not). So, how do we estimate the effect of future US and China conflicts on AMD value?
When uncertain, people like to go to institutions and “authoritative” sources because they think “they must know more than I know,” the seven most destructive words in investment and decision-making. But let us take a look at what the “authoritative” source said.
The following news from CNBC shows how Goldman Sachs forecasted Chinese stocks in November 2023. Will the source make you feel safer? Don’t celebrate yet if you do.
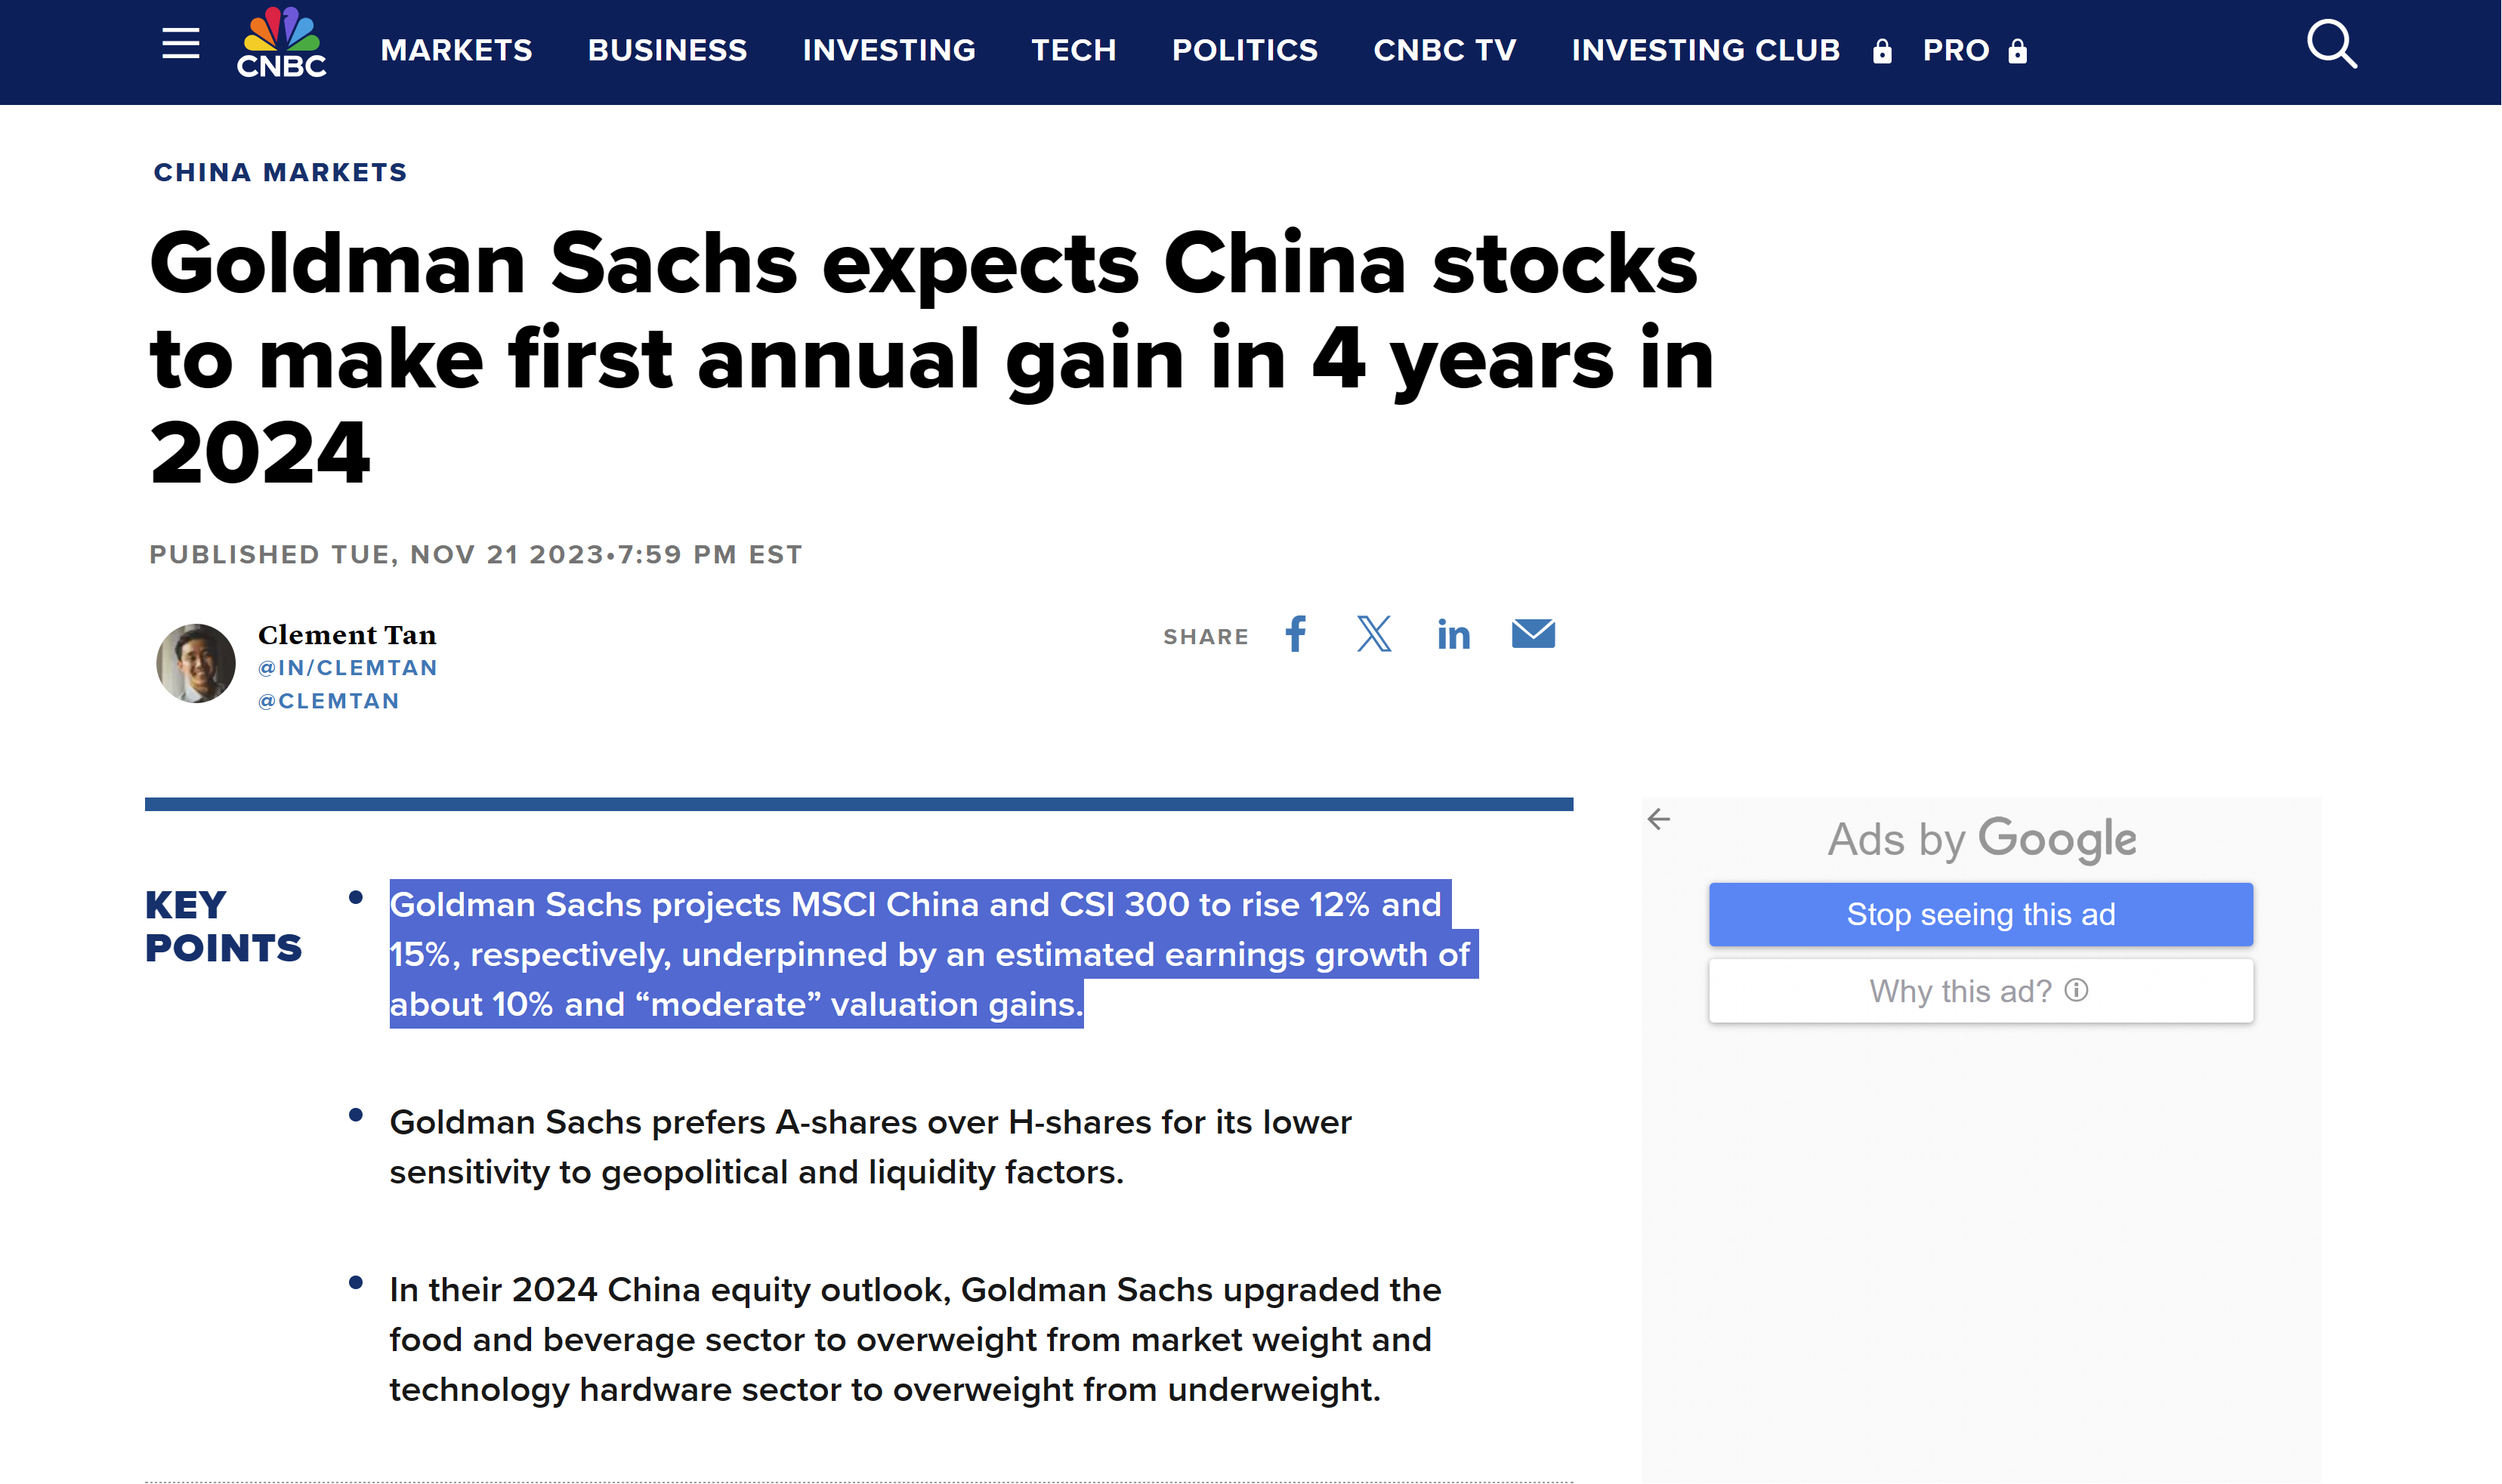
The following news from Bloomberg shows Goldman Sachs’ forecast in March 2024.

In just four months, one of the “authoritative” sources has completely changed the tone. I need to clarify that I don’t keep my eyes on their claims because I never care. I received this news from some of my friends and connections during our daily conversation and used it as a source of jokes. However, you can tell that “Authoritative” sources do not necessarily help you. So what can you do?
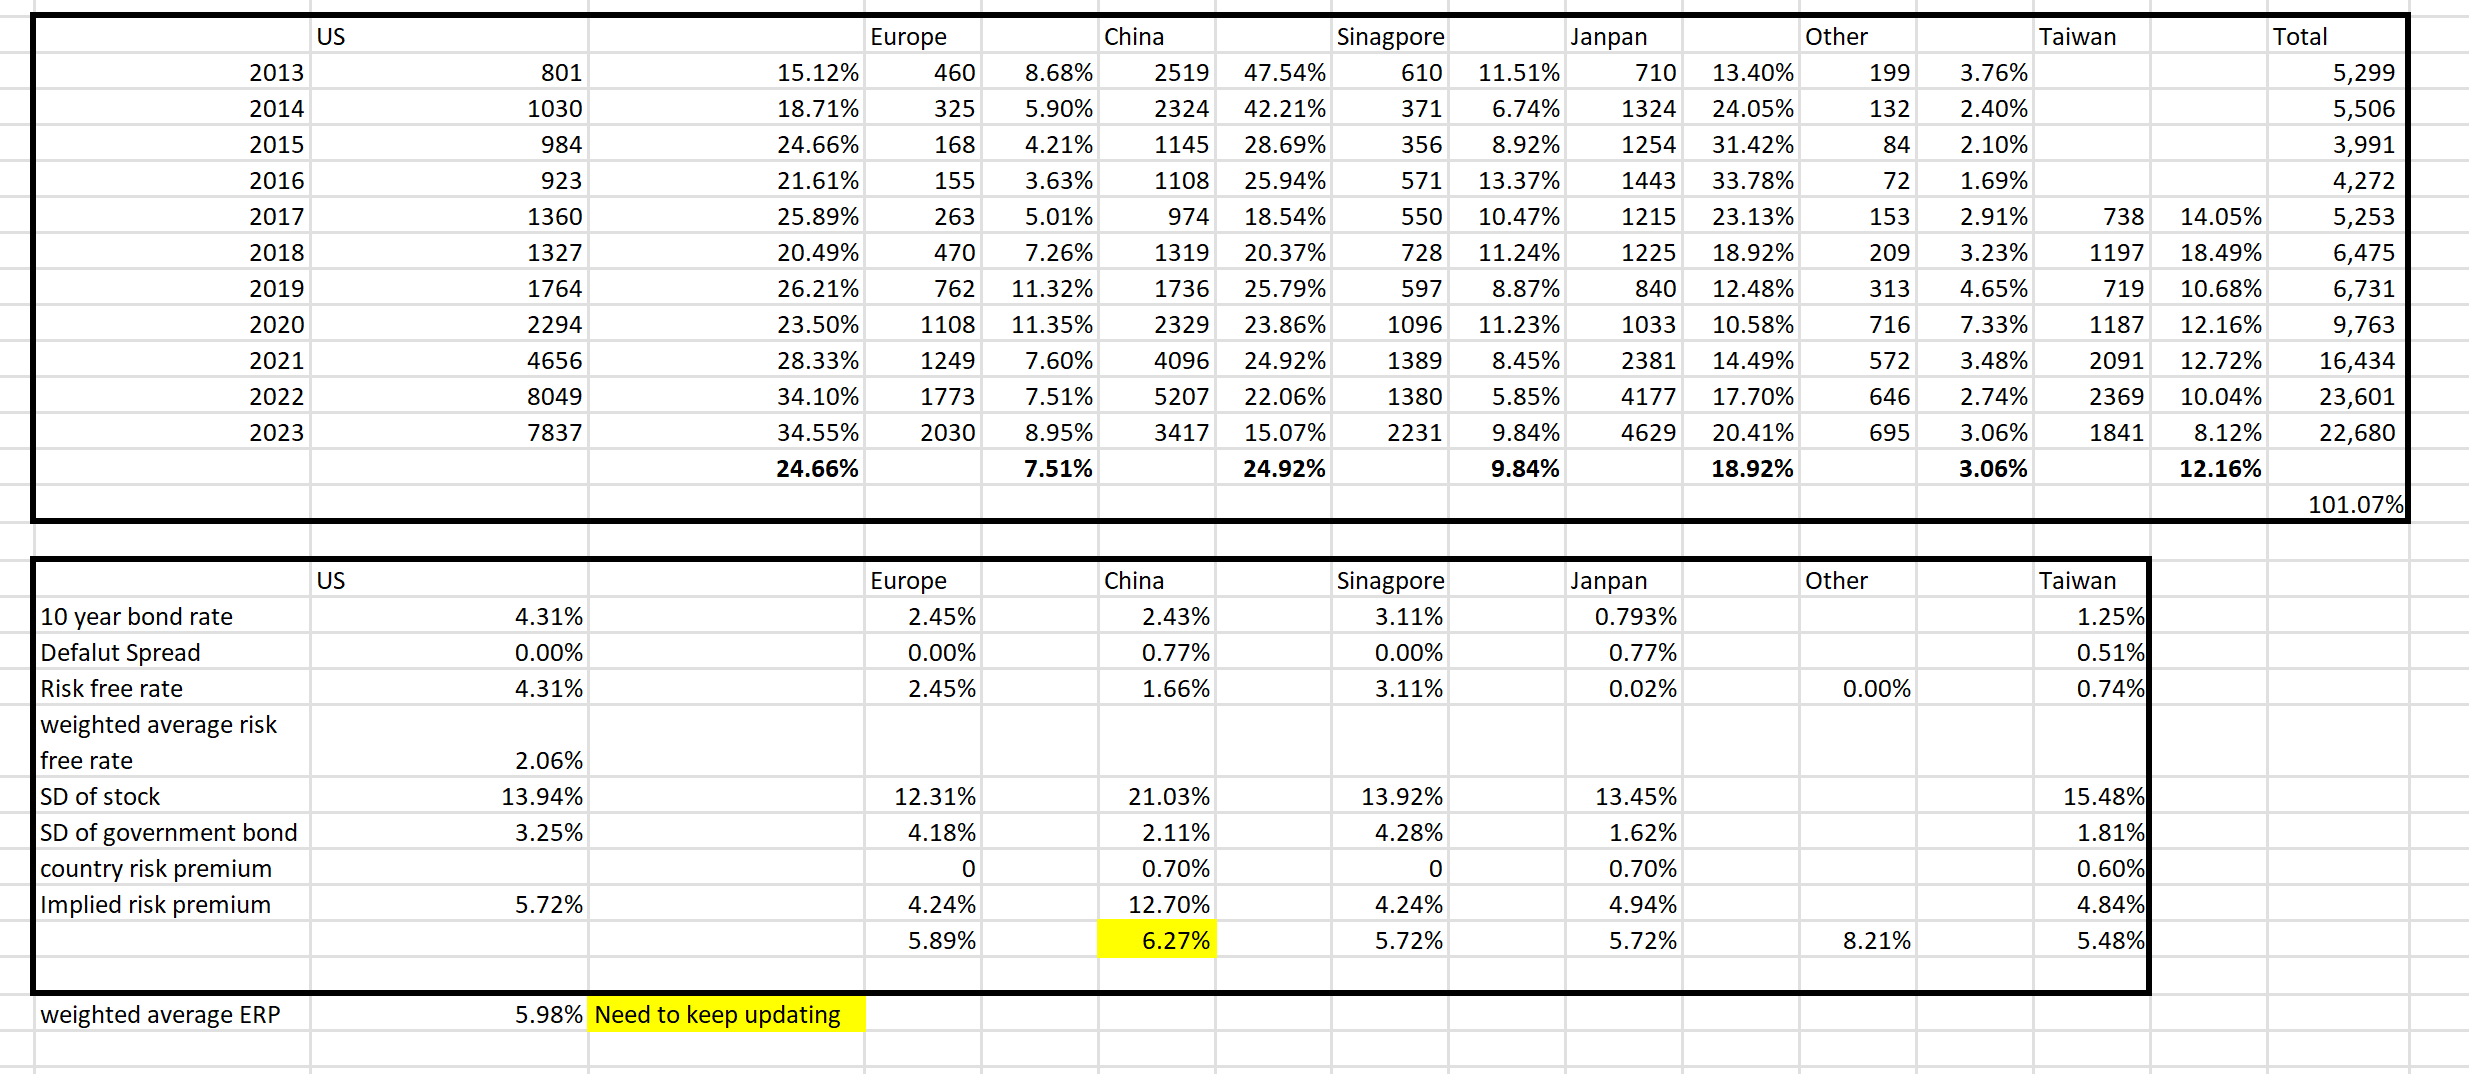
Since my first stock analysis, I have separated the company’s revenue by region because I know different countries and regions have different risks. The figure below shows China represents about 25% of AMD’s revenue. The next question is, should I subtract 25% of revenue from AMD to “be safe”? I don’t think so for two reasons.
First, like I said earlier, a country rarely completely bans another country’s product, even during the trade war. The recent US ban on semiconductor export to China is restricted to advanced chips for AI rather than all semiconductors (some for automobiles, electronics, etc.).
Two, even if the AMD loses revenue from China, it will have other revenue sources from countries like India and the Middle East as those countries grow.
I can learn about different types of AMD chips and estimate which type of chips would be banned and how much revenue is from those chips. But I take a shortcut here. In the FCF model, I subtract 12.5%(half of 25%) of revenue for each year's forecasted revenue. Now, you can see the advantage of the free cash flow model. It is much easier to adjust than traders’ price/earning ratios. If the US enforces a semiconductor ban, the estimated intrinsic value for AMD stock is about $151.21 per share. It decreased from the original estimate, but still not that much.
AMD revenue by region
AMD Free Cash Flow (if US ban semiconductors export to China)
Attention:
To adjust to the Chinese effect, I expect other new demands will be from countries like India. If you see the picture titled AMD revenue by region, China has a 6.72% implied risk premium, while India, through my research, has a similar implied risk premium. But if you expect another country to replace all Chinese demand with lower risk, you need to not only adjust revenues but also risk premiums (for example, Japan). Whether the company value will go up or down depends on whether the effect of reducing revenues outweighs the impact of reducing risk premium. A consistency check is always necessary.
Double-check forecasted stock option issues.
It is time to see whether my estimate for AMD’s future stock option issuing is reasonable.
The following data shows AMD’s history of stock options I summarized.

The beginning and ending balance shows how many stock options are in employees’ hands at the beginning and end of the year.
The exercisable balance means how many shares are qualified for exercise(allowing employees to buy stock at a specific price) for the current year.
The shares granted means the amount of new shares the company grants to its employees for the current year, and the granted exercise price means the price the company set to allow the employees to buy. (Ex:$108.19 means the stock options issued in 2023 allow AMD employees to buy the stock at $108.19 even if it goes to $200 or higher).
The forfeit amount and rate show how many stock options the employees give up without exercising.
The median stock price is the market stock price for a year. I calculated the company’s history market stock price for a year.
The expected life is how long the stock option is valid. The company usually set a time horizon for employees to exercise the stock so that they do not keep holding until the stock goes very high.
I listed the company’s data and information out like this every time I am not sure what to do but try to find some clues. And I can always find a solution ultimately. Most of the value work is not formulated until it makes sense. All you can do is keep working, thinking, and not expecting.
Several things I found from these data:
AMD’s management issues about a stable amount of stock options (about 1 million shares) every year except for 2020 COVID-19, and when the company just started to grow and is not making money.
The exercise price AMD’a management set is close to the market price of the year the option is granted. While it is expected that the company will not set the exercise price much lower than the current stock price(otherwise, every employee will exercise immediately), some companies will set the exercise price very high as a way to keep the managers focused on long-term growth or they just don’t want to give employees compensation in stock in fact.
AMD employees generally exercise all stock options except during the early years. It is understandable since most companies’ stock has little growth during the early stage when they are losing money.
Back to the forecasted stock compensation and the present value of future stock compensation in my free cash flow, as the following pictures show.
AMD Free Cash Flow (based on its historical growth) (3/14/2024 after market close)

AMD Free Cash Flow (based on AMD relative to the industry average)

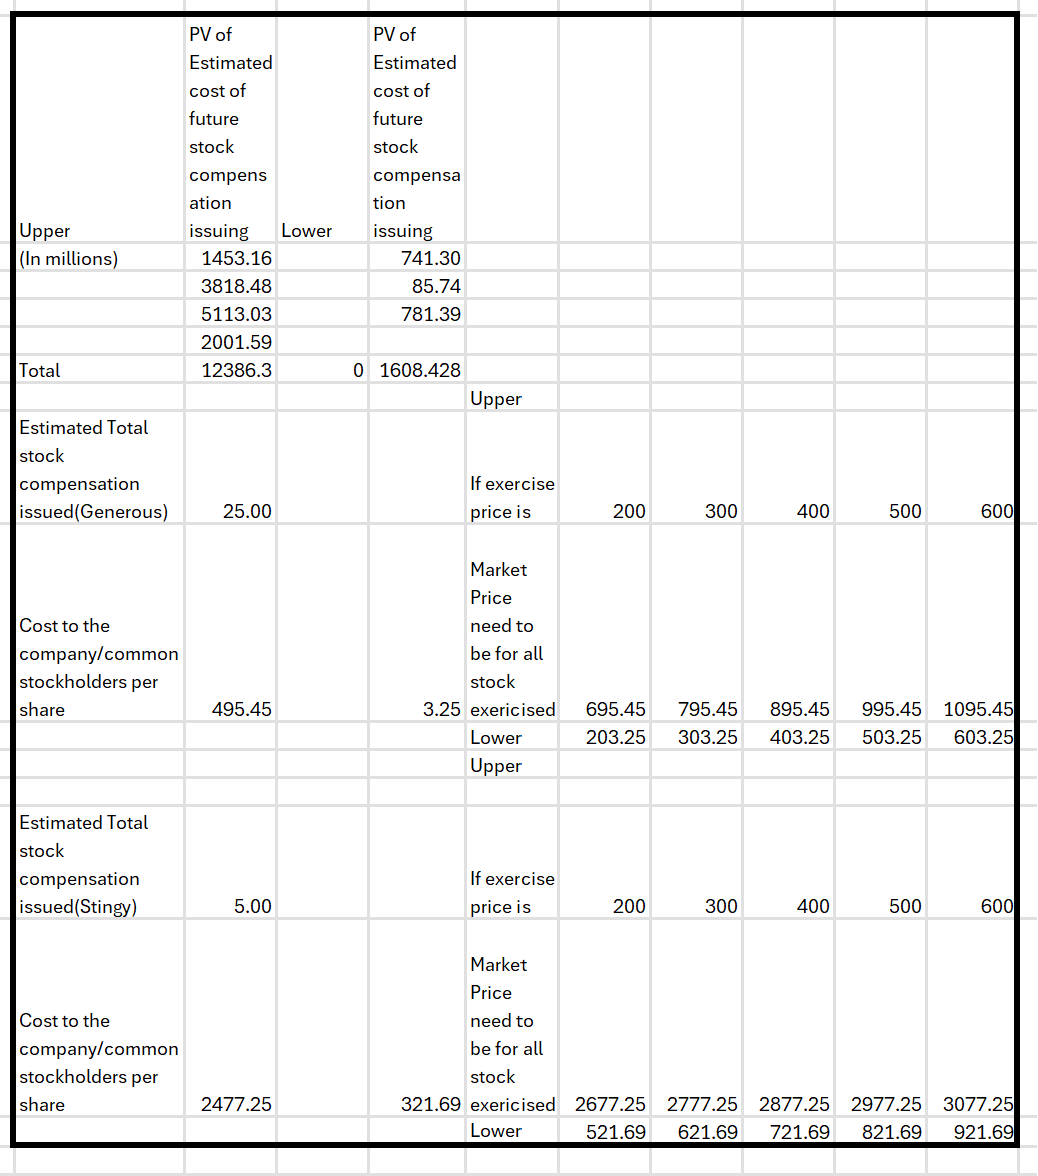
Now I know how many stock options AMD may issue each year in the future and know that AMD usually issues the stock option with an exercise price close to the market price of the year of issuing. I can try a simulation by myself as follows.
My goal is to estimate How much the market stock price needs to be for AMD to spend all estimated reinvestment in employee stock options.
For example, if AMD has my estimated growth based on its history(high) and issue 5 million employee options each year, and I expect the company to issue that for five years(implying five-year high growth),
the stock needs to go to $695.45 if the exercise price the company set is $200 and all employees exercised all options;
the stock must go to $795.45 if the exercise price the company sets is $400 and all employees exercise all options…
Suppose AMD keeps issuing 1 million stock options annually, as it did before. In that case, the stock price needs to go much higher (though unlikely) for the company to spend all estimated reinvestment on stock options.
So, I am comfortable with using my estimated stock compensation. And remember that my estimated stock compensation is based on my total reinvestment rate, while my revenue growth is based on my reinvestment. I may overestimate the stock compensation cost to the company, but that only makes me underestimate the company a little bit, and my worst case is not buying the company. Don’t forget that investment bankers and traders will add all current stock options to outstanding shares, underestimating current stock price and underestimating future stock compensation. I never need to be right all the time in the stock market, but I just need to be less wrong than others.
Pricing
The analysis above estimates how much the company is worth as an investor. However, to invest in the public market, you need to know how much traders price the company to take advantage of their oversold or overbought actions. To learn how to price a stock like a trader, please check my previous TSMC valuation and search “Part 4-Trader/Investment Banker pricing”. But if you are in a rush, I have a short example. Recall when you needed to buy football tickets from Facebook Marketplace or others during a hot game with two great teams. The price will not be based on the official price but on how many people want the ticket and how many people offer and want it. A ticket sold for hundreds of dollars from the website can jump to thousands. Now, imagine you are a billionaire who wants to buy a football team. Will you value the team’s future revenues based on how much the ticket is sold on the Facebook marketplace? You will not. You will estimate the future cash flow based on the official ticket prices, how many tickets can sold, and how many years of running, in addition to advertisement, souvenirs with team logos less the salary paid to players and the coach, the expense to rent the stadium, etc.
The traders’ pricing is like that of sellers and buyers on the Facebook marketplace.
The investor is like the person wanting to purchase the team(or a piece).
AMD pricing (based on its historical growth)

AMD pricing (based on AMD relative to the industry average)

AMD pricing (If US bans semiconductors to China)

As you can see, the traders’ pricing ranges from $70 /share to $1000/share. I know you feel they are too volatile and give little meaningful information. I agree, but this is a fact for traders, just like football ticket prices sold on the Facebook Marketplace.
After all, they are like Goldman Sachs, which was super optimistic about Chinese stock in November 2023 and then told you not to invest in China in March 2024. If you are confused, you can check my previous post to see how that works. And if you think these forecasts for traders are too unrealistic, take a look at Nvidia stock from 2020 to now. But the good thing is that I don’t need to buy based on traders’ pricing.
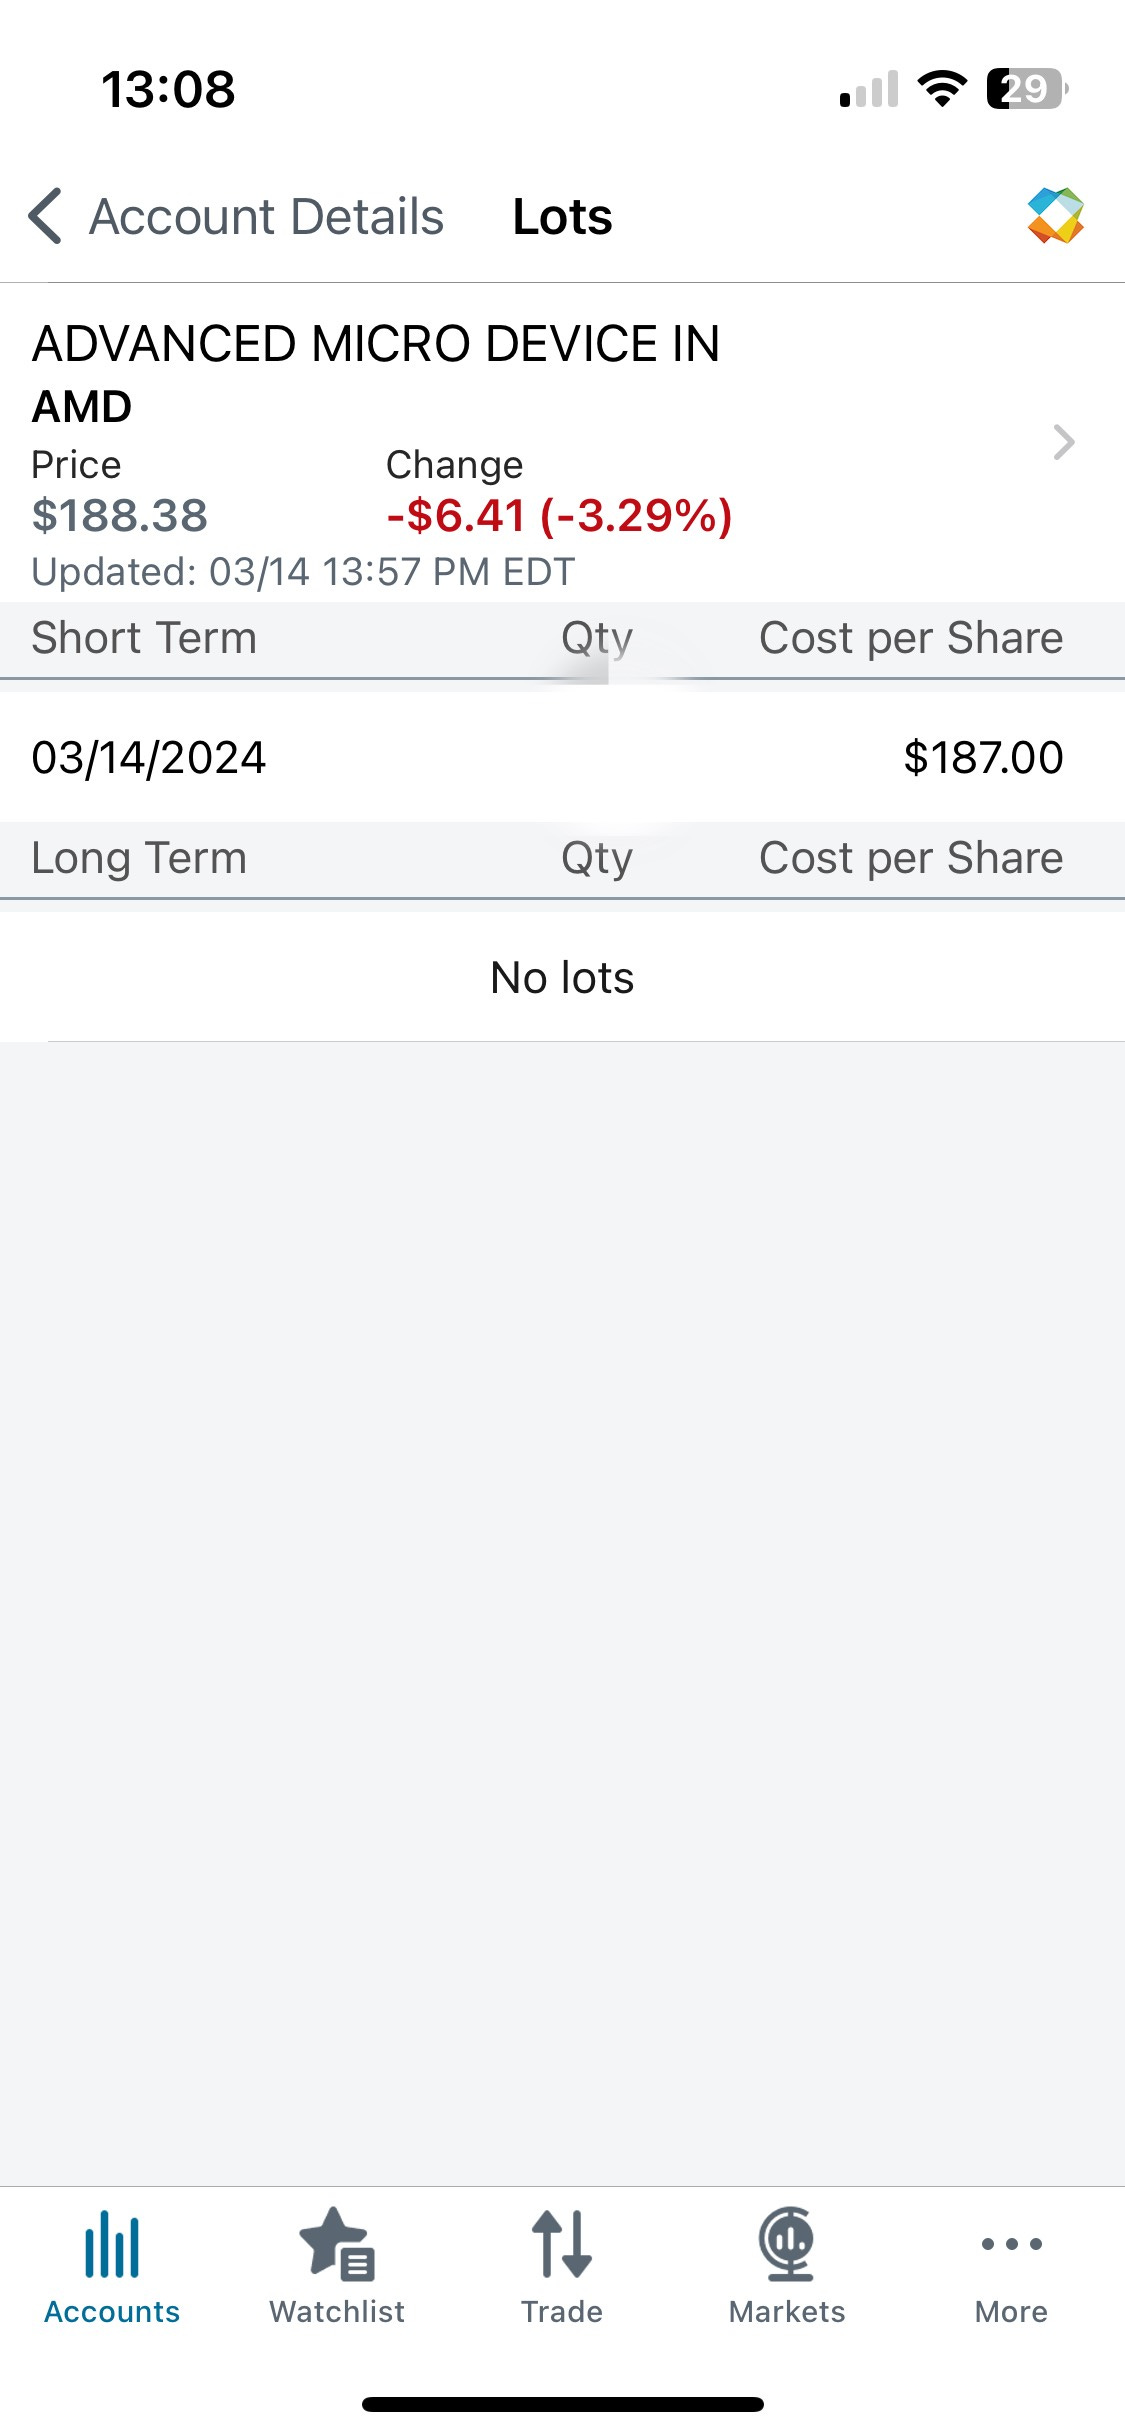
The intrinsic value I calculated on March 14, 2024, before the market opened, is $208.61. The stock decreased to $189 after the market opened.
The question is did I buy it? I did. Otherwise, what’s the point for me to do the stock analysis?
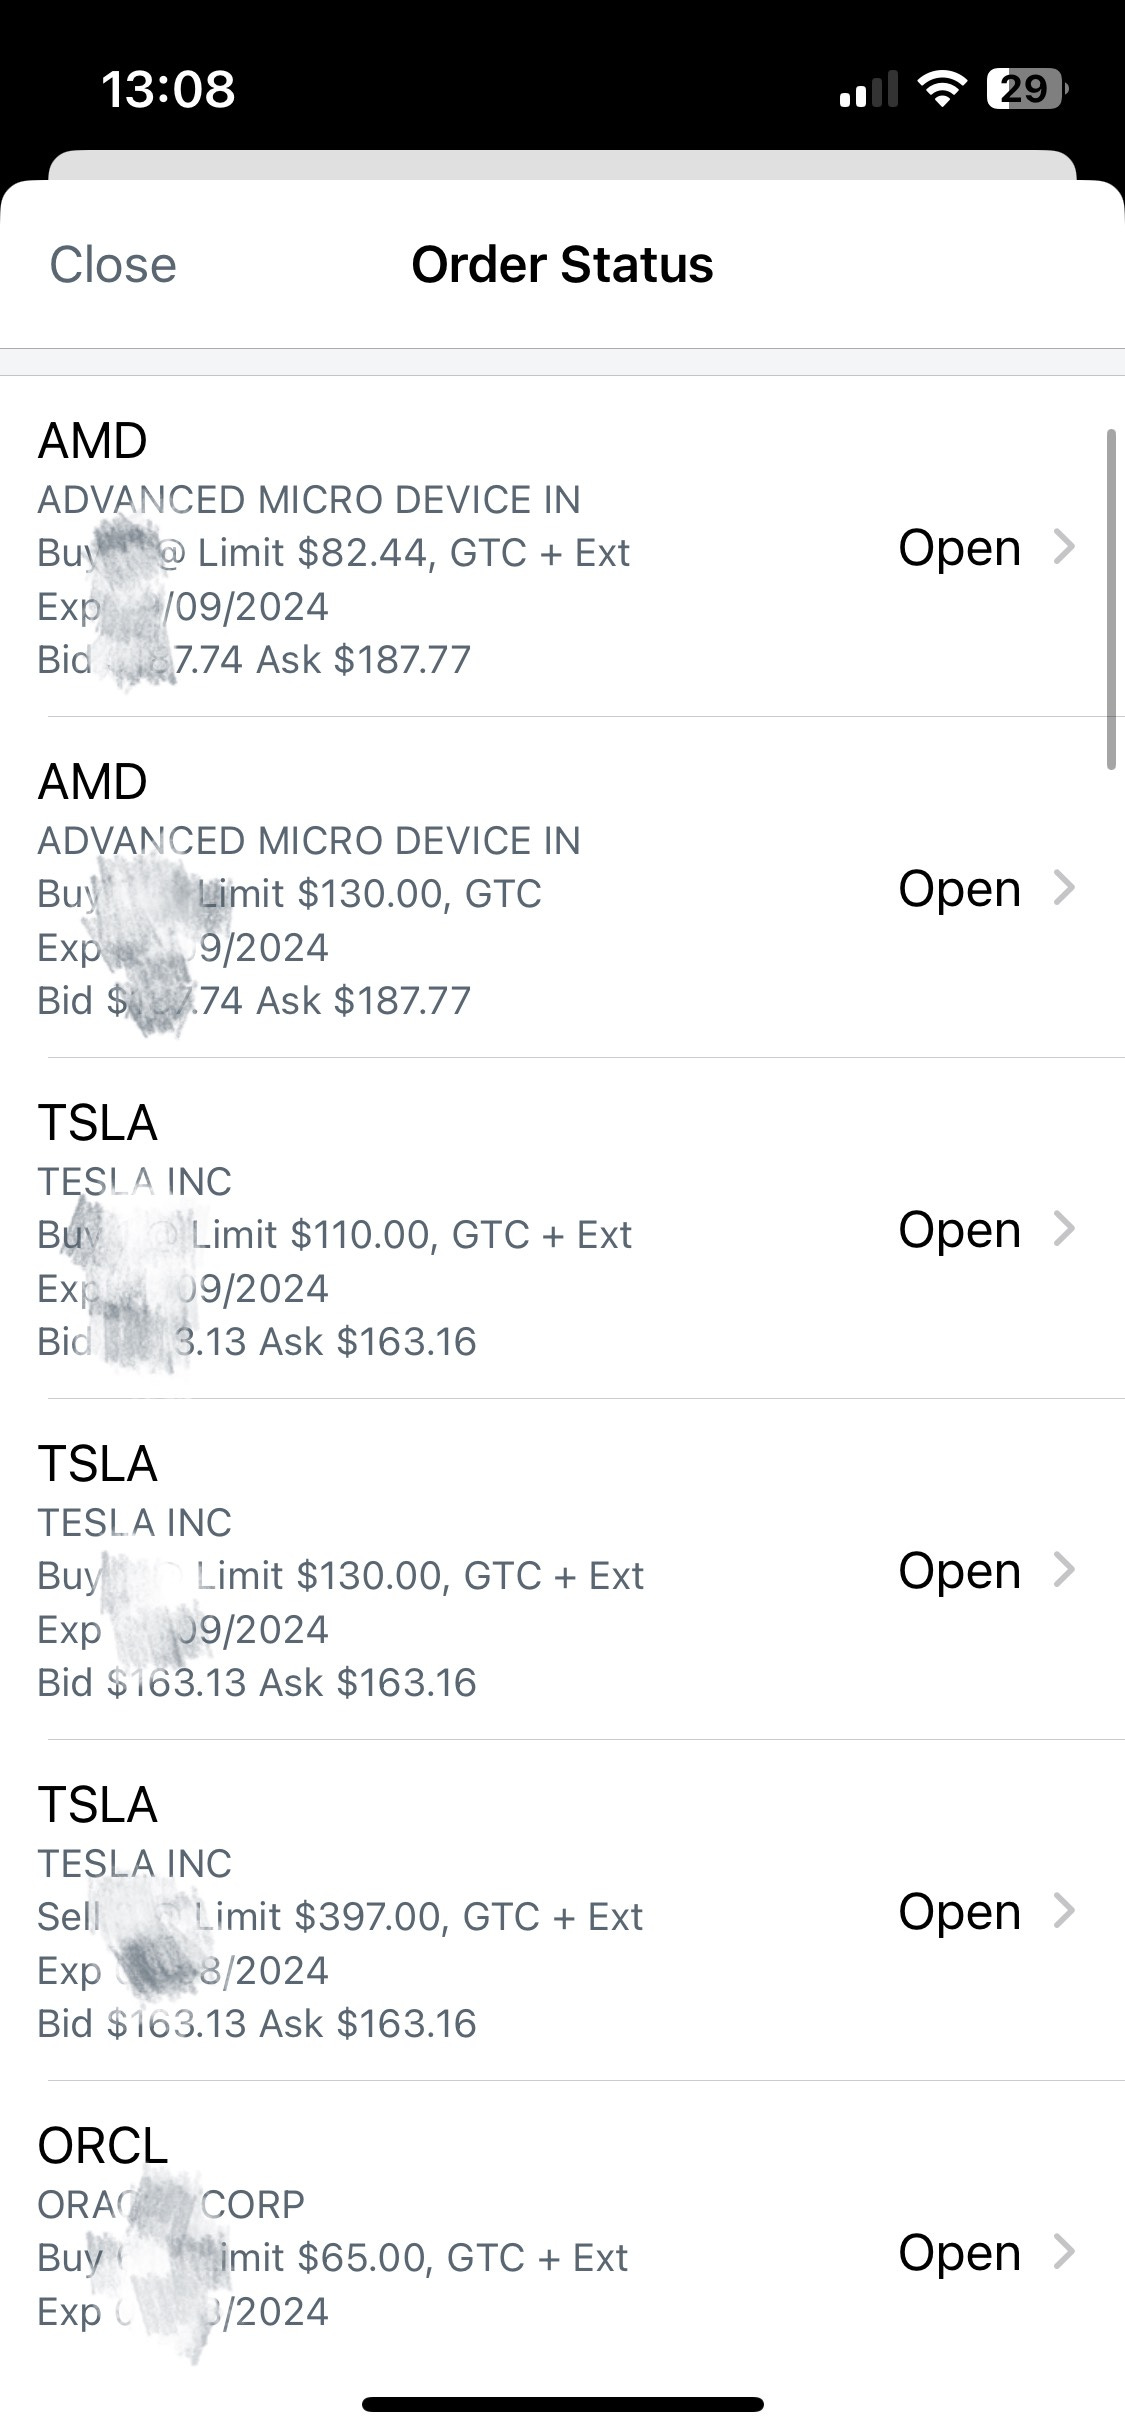
But I only bought 1/3 of total AMD shares I planned to buy, and I will buy another 1/3 at $130-140, and another 1/3 at around $80-90.
Why do I do that? I bought TSMC and other semiconductor stocks from 2021-2022, which are correlative because AMD is TSMC’s second-largest customer. If I estimate the value of AMD correctly, I will gain capital from both AMD and TSMC. But if I am wrong, I will encounter a double whammy. But if traders help me push the stock down to $80-90, I feel ok to buy the stock because my valuation told me that AMD is unlikely to be worth that little. Since I use the free cash flow model, I can play with the number to see how low the revenue needs to be for the intrinsic stock to be $80-90. For the intrinsic value to be $80-$90, AMD’s revenue needs to decrease to the 2021 level. But the good thing is that traders, who like buyers and sellers on Facebook MarketPlace, can make that happen to help me buy at low. There is still a possibility that I am wrong, but the change is much lower. I am okay with taking the risk and responsibility for that. If I don’t have that many semiconductor stocks on hand, I will buy 4% of my total investment in AMD as long as it is traded at equal or lower than fair value.
The most important lesson:
If you remember the video I showed initially, I valued AMD at $105-108 on August 2nd, 2022. You may wonder if I buy during that time. This is my first company to value, and after I valued it at $105-108, I made two mistakes.
1. waiting for the stock to decrease to buy. Why? You must have heard people keep saying, “Buying at low and selling at high,” I can recall few useful knowledge from some of my financial professors, but words like this. But later, I learned from life and my own reflection that buying at fair value is not a bad decision. Imagine you really have some way to value a house at 1 million. Will you buy it or wait for it to decrease a little more? You can wait, but it may bounce back quickly, and you will never be able to buy at $1 million afterward.
2. After the stock decreased to $50, I started to doubt my valuation because I thought those investment bankers and analysts" must know more than I know”, and I didn’t know what to do after it jumped back. I am not saying that there are no analysts better than me, but if you value a company and then just follow others rather than have faith in yourself, then don’t bother to value a company in the first place. Just go to be a trader.

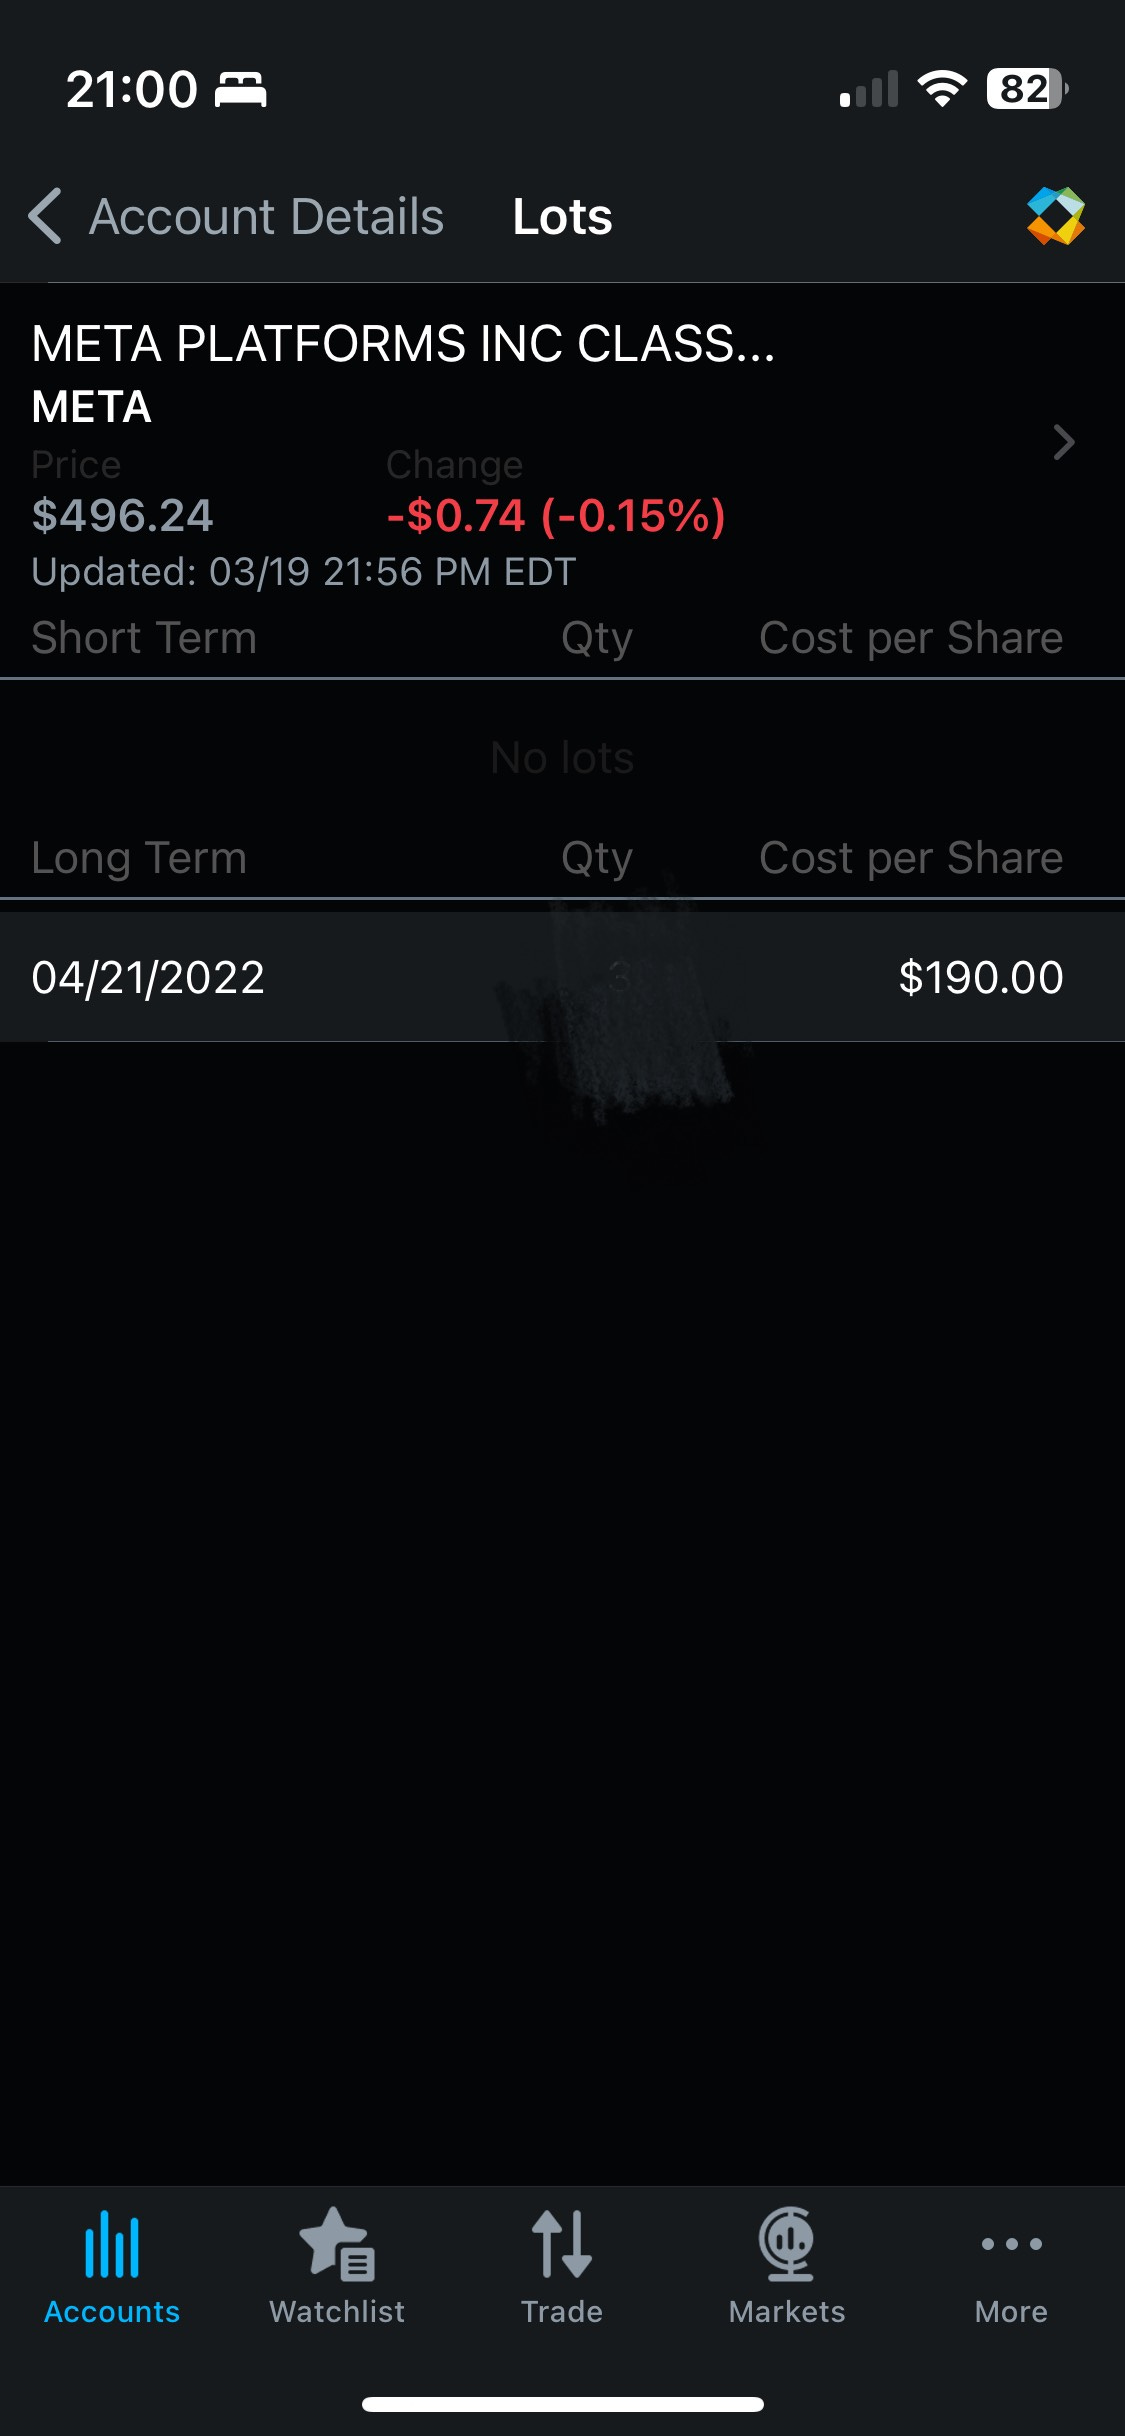
While I didn’t make a capital gain from my first valuation, the lesson I learned made me not hesitant to buy anymore after I finished my Costco stock valuation and I have capital gains even if I made a serious mistake.(Of course, the best thing is not to make mistakes and to always double-check. I also did the same for Meta(Facebook) and Amazon. I ended up making more capital gain than I should have made in AMD.
I would rather learn such a lesson than make a capital gain from AMD two years ago with an incomplete valuation. You can expect what would happen if I bought AMD at $105 two years ago. I will wait for 100% gain to sell (or 50% if I am an accountant and claim I am conservative), become complacent, stop learning and growing, and ultimately lose money.
When you try to take shortcuts, you will ultimately fail even if you get windfall in the short term.
When you count yourself and put in effort, you may fail in the short term but will gain in the long run.
I hope you find this post to be helpful.

correction:
Under
2. No company can maintain efficiency forever...
It should be
Year 2 revenue growth=year 1*(1+35.55%),
Year 3 revenue growth=year 2*(1+35.55%)
My laptop gets stuck whenever I try to edit the passage manually, so I am commenting here.
Probably because I need a better CPU!
One of the most comprehensive analyses I've read. Great job, I'll be adding my position tomorrow.