Oracle Stock Valuation Part 3-Earnings and Free cash flow
Earnings and Free cash flow
To estimate the future earnings, we will need to know the future revenues and profit margins.
To estimate future revenues, we need to know the future reinvestment rate and return on invested capital.
Recall that the reinvestment rates are as follows:

So I first calculate:
Oracle’s Capital expenditure (from financial statements)/sales ratio
Depreciation/Capex ratio
NOWC/Sales ratio
R&D/Sales ratio to estimate future investment.
(I will explain how to deal with acquisition later).
In essence, all items above should be Capital expenditure. But the “capital expenditure” we include here refers to the traditional accounting definition of capex, and you can find the explanation in my previous post by searching “Traditional accounting”.
However, I got new challenges.
Figure 1
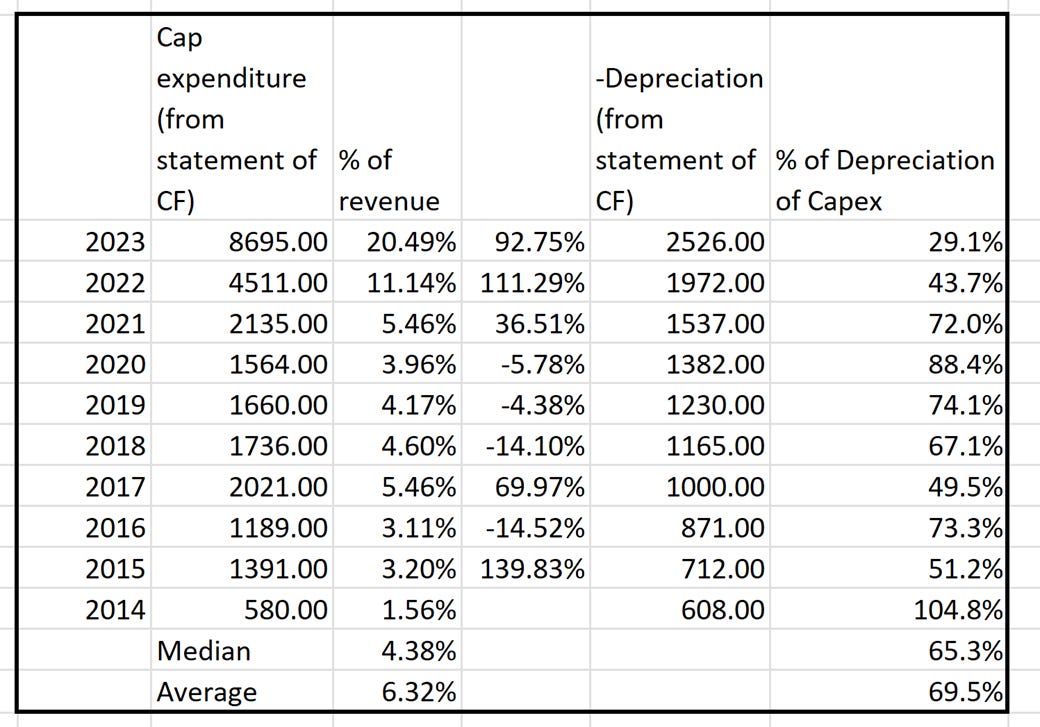
As you can see, Oracle has few capital expenditures on cash flow statement before 2021.This makes sense since a technology company mainly invests in R&D (research and development) while accountants fail to recognize them as capital expenditures.
Another significant capital expenditure, especially for Oracle, is M&A, which is also not recorded as capital expenditure by accountants.
But the capital expenditure doubled in 2022 and 2023.
I first tried to use the industry average capex/sales revenue ratio, just like most investment bankers and private equity analysts did.
As you can see, if we use the industry average capex/sales ratio, the Capital expenditure will explode from $8695 million to $41137.4 million in 2032. The Capex is only about a quarter of the total reinvestment in 2023 but will be over 80% of reinvestment in 2032.
Reinvestment (the wrong example-You don’t want to do it!)
Figure 2

Let us pause and come back to review the part 1.
Figure 3

Figure 4
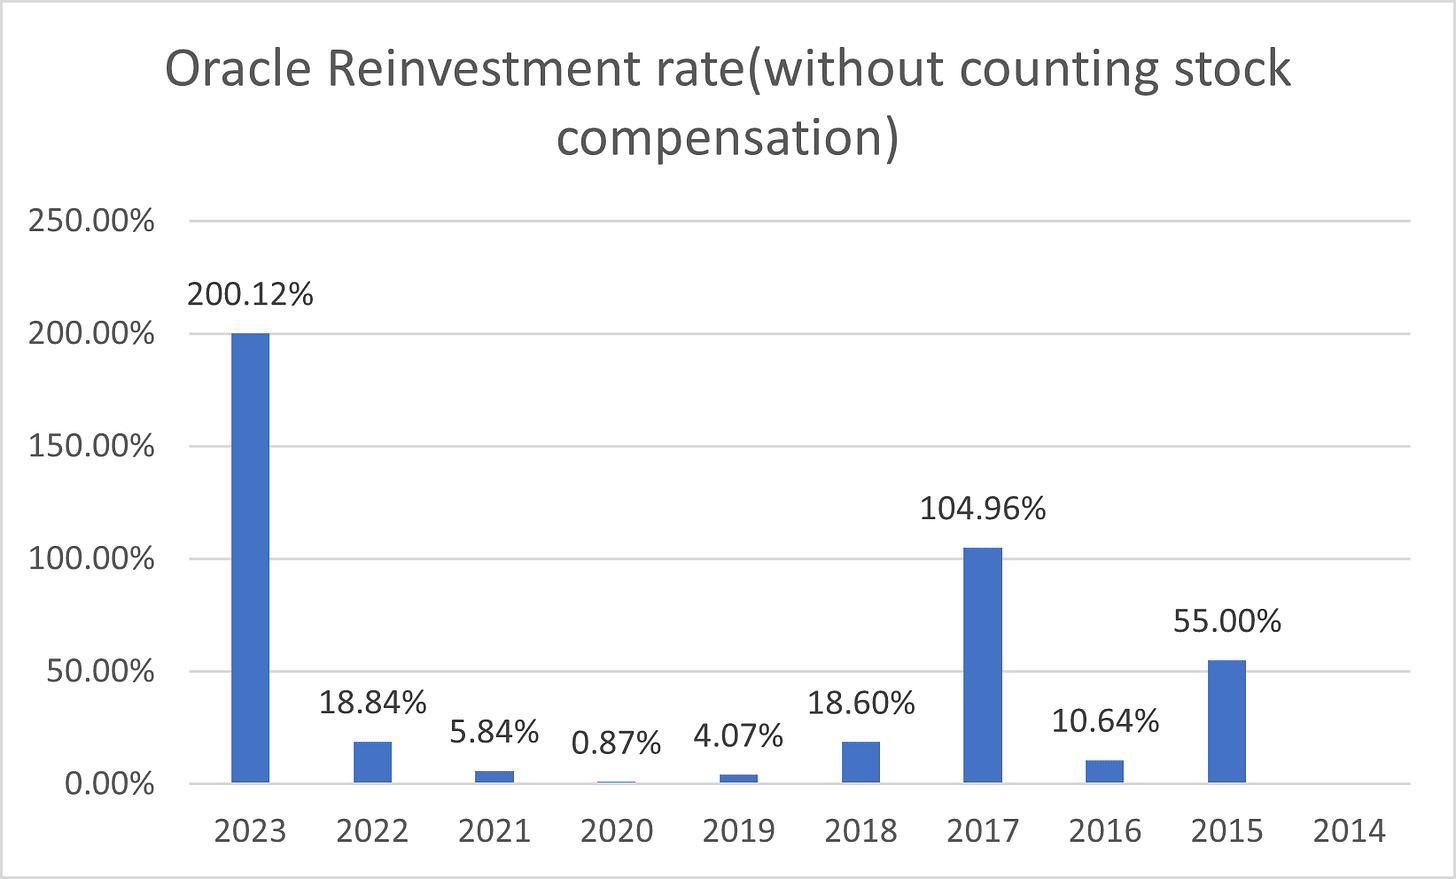
Figure 5
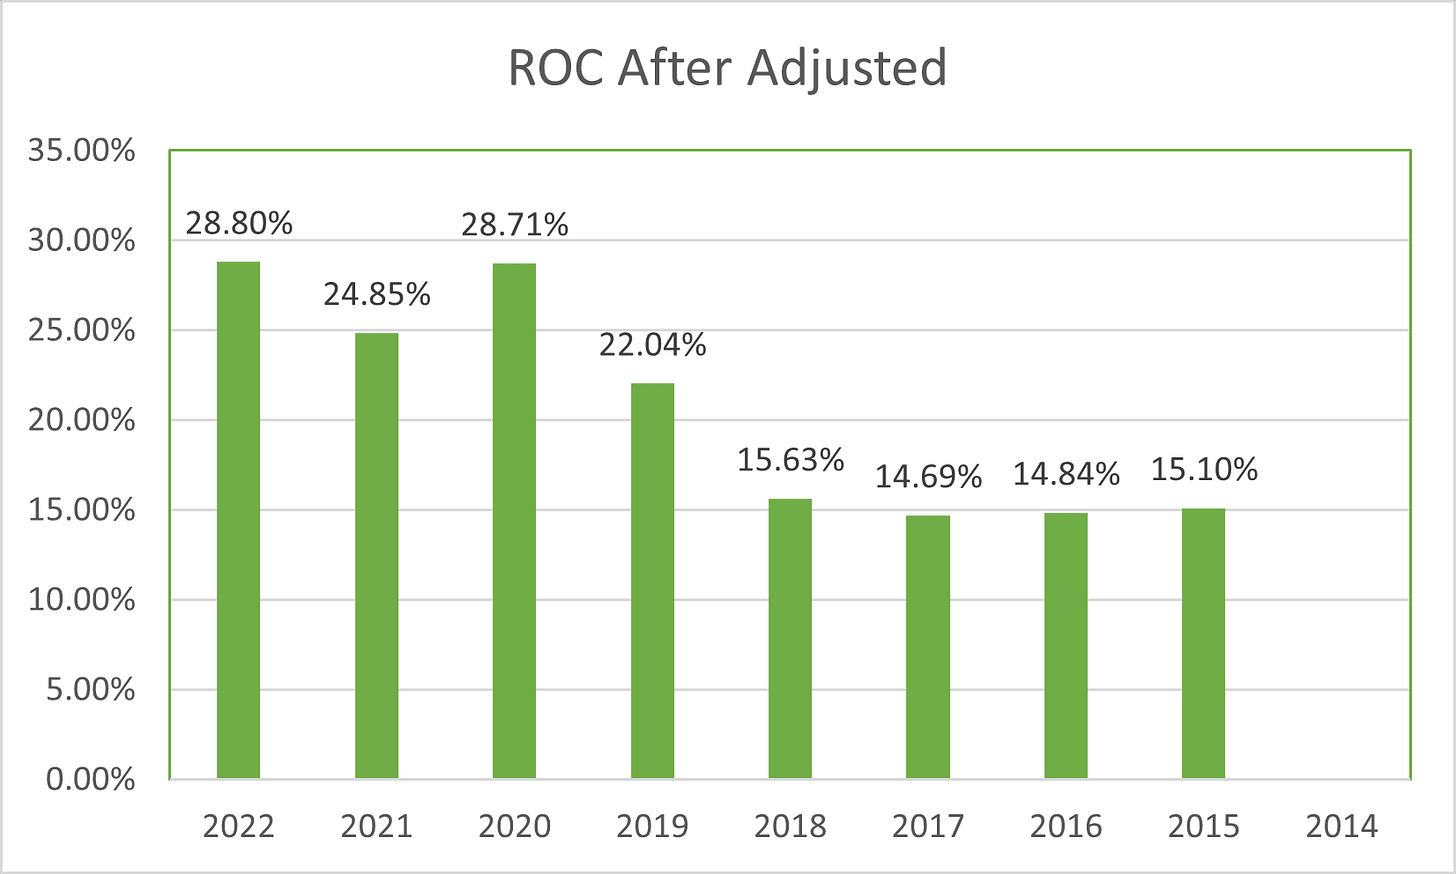
Figure 6
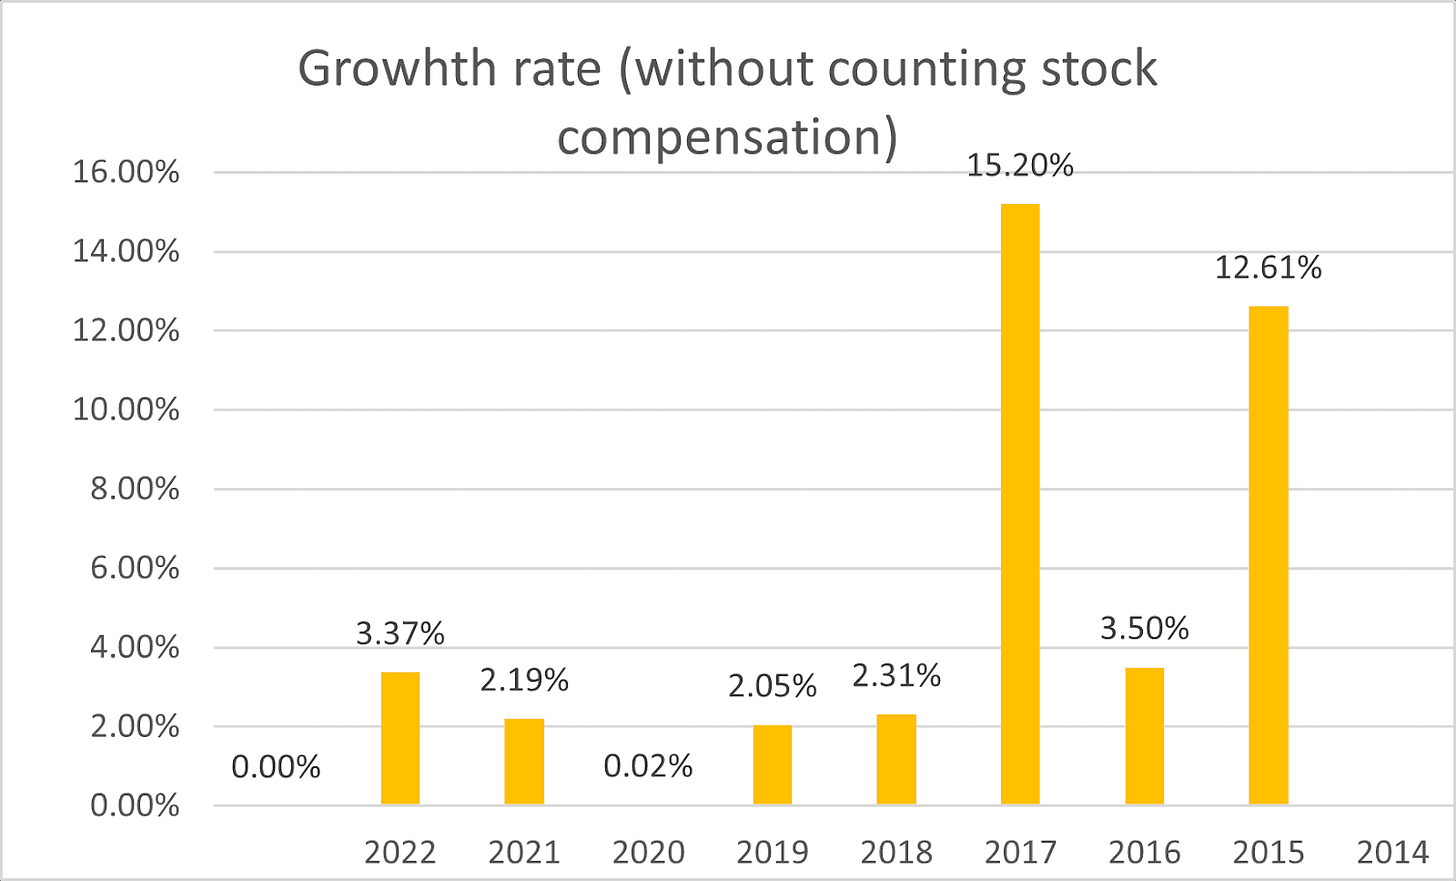
Figure 4,5,6 shows that Oracle only has noticeable growth whenever they have large acquisitions in 2017 and 2015. So, I just need to focus more on the acquisition for reinvestment and growth rate.
So I decided to calculate the Net capex (capex-depreciation from cash flow statement)/Acquisition Cost ratio and use the number to estimate the Capex accounting definition. We use Net Capex because, in the free cash flow calculation, we subtract the Operating income from Capital expenditure and then add back depreciation since companies can reduce income tax by recording depreciation as an operating expense while the company doesn’t need to pay the actual cash.
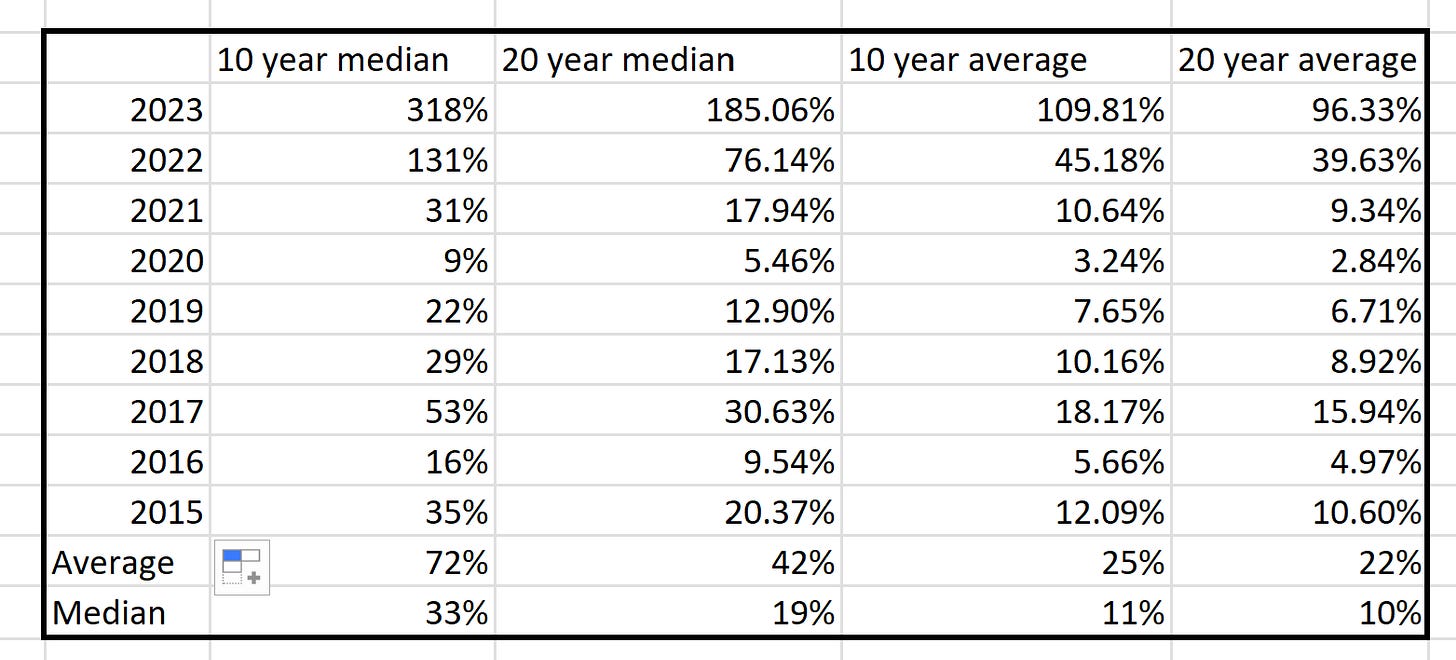
Figure 7 below shows the Net capex from the cash flow statement as % of Oracle’s median/average M&A cost. Compared Figure 7 with Figure 4, you can find that the “accounting” net capex number follows the size of M&A. By doing so, we factored in the M&A when estimating the accounting capex number, and the number is more reflective than the net capex/revenue ratio.
Commonsense check:
1. Since Oracle heavily relies on M&A, the same one dollar spent on “accounting” Net capex will have a much lower return than one dollar in M&A. So, I don’t think we should add the net capex to the total reinvestment to calculate the growth rate. However, I still need to calculate how much the company spent on things like building a factory or purchasing equipment and buildings and subtract that from the free cash flow calculation. So, I can just estimate the growth rate separately. The logic behind that is the company will spend some money on accounting capex anyway, but that may not directly contribute to growth. And I think that makes sense. For example, if a company buys some new corporate offices, that might not necessarily increase the sales revenues, and the cost is still necessary.
2. While Figure 7 shows the percentage of accounting capex/total M&A, the median number will make more sense than the average, and I think the 33% number using the 10-year median M&A expense is too high. I may not consider stock price calculating from that 33% net capex ratio later.
Figure 7
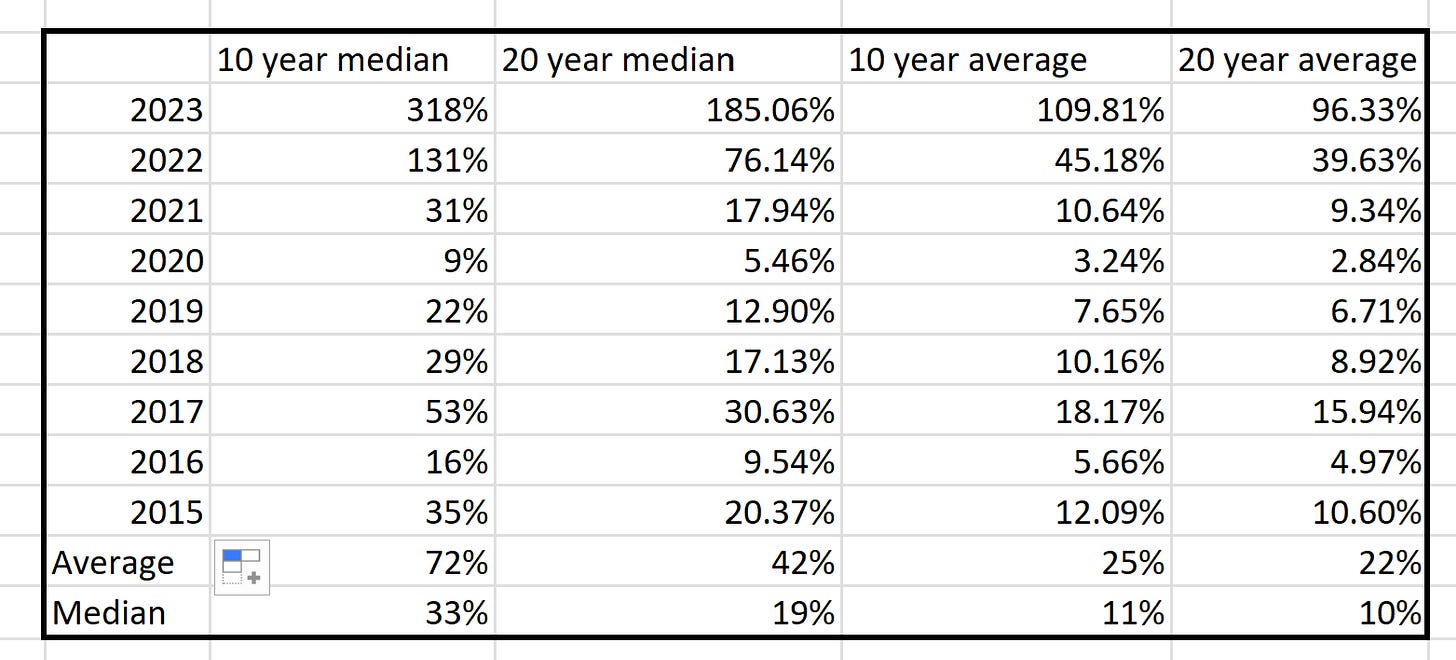
With 3 different Netcapex/M&A ratio, which one should I use? Stay with me and I will show you later.
NOWC/sales ratio
While you can check the general definition and calculation for NOWC from my previous post, I need to make adjustments for Oracle. Many technology companies have negative NOWC since they will have “Deferred Revenue” as current liabilities. Deferred Revenue is an accounting term that means that the company has collected the revenue but hasn’t delivered the product or performed the services. For most software companies, they will charge client and customer invoices in advance. That’s why Oracle has negative NOWC, and that will increase the company's free cash flow. However, since I estimated NOWC by NOWC/Sale revenues. Using an average negative NOWC will assume that the company can increase FCF with that forever, and the number can be huge as the company's sale revenue increases.
The median NOWC ratio for Oracle is Negative 24.21%, while the industry average for the software(application) from the NYU Stern database is 13.03%. So, how do I estimate the NOWC rate for each year in the future?
Figure 8
NOWC calculation

I recall that I have a connection from Goldman Sachs, who told me that the company asked him to estimate each year’s NOWC amount for a company, and he is confused. I told him I don’t know either, but why do I need to know the each-year number. Imagine that you want to estimate a restaurant’s annual revenue then you don’t have to know the daily revenue to estimate that.
Figure 9 shows what I did. I use the median negative 24.57% NOWC rate for 2023, then gradually increase the NOWC rate to 13.03% in terminal value calculation. How much should I increase each year? I increase 24.47%/4 each year until the rate becomes 0 and then increase 13.3%/6 each year until it reaches 13.3%. By doing so, I expected that Oracle could still get an increase free cash flow from negative NOWC for 4 years, but after the NOWC will reduce its free cash flow, and the company will spend a similar amount as the industry average.
And since we discount each year's expense by the cost of capital when we calculate the present value at the end, I don’t care about if a single-year NOWC matched the actual NOWC. In other words, I don’t need to worry about estimating a restaurant’s single-day revenue when I value the annual revenue. I just need to estimate how many courses they will sell on average and how much they charge on average.
Figure 9
NOWC estimation
(Attention: the Free Cash Flow numbers in this Figure is just one scenario I run and does not represent all information about the final stock price).

R&D expense/Sales
Figure 10
Oracle non-stock compensation R&D as % of revenues
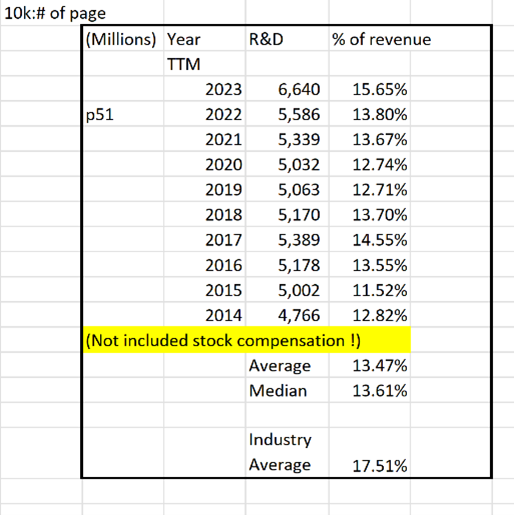
Stock compensations are the right companies give employees to buy stock in the future with a certain price, and you can check more detail by searching “Stock compensations in SG&A” in my previous post. While they are the company’s cost, including them in R&D now will assume each dollar in stock options will have the same effect as each dollar invested in general R&D(such as money spent to research and develop ERP or data management). So, I will exclude here but calculate the stock compensation in R&D with other stock compensations in my next post.
Oracle Growth Rate
From the calculation in part 1, I calculated the return on capital(ROC) for Oracle, and with the work I have done in this post, I can know the total reinvestment rate by adding up items above/last year's adjusted operating income.
Figure 11
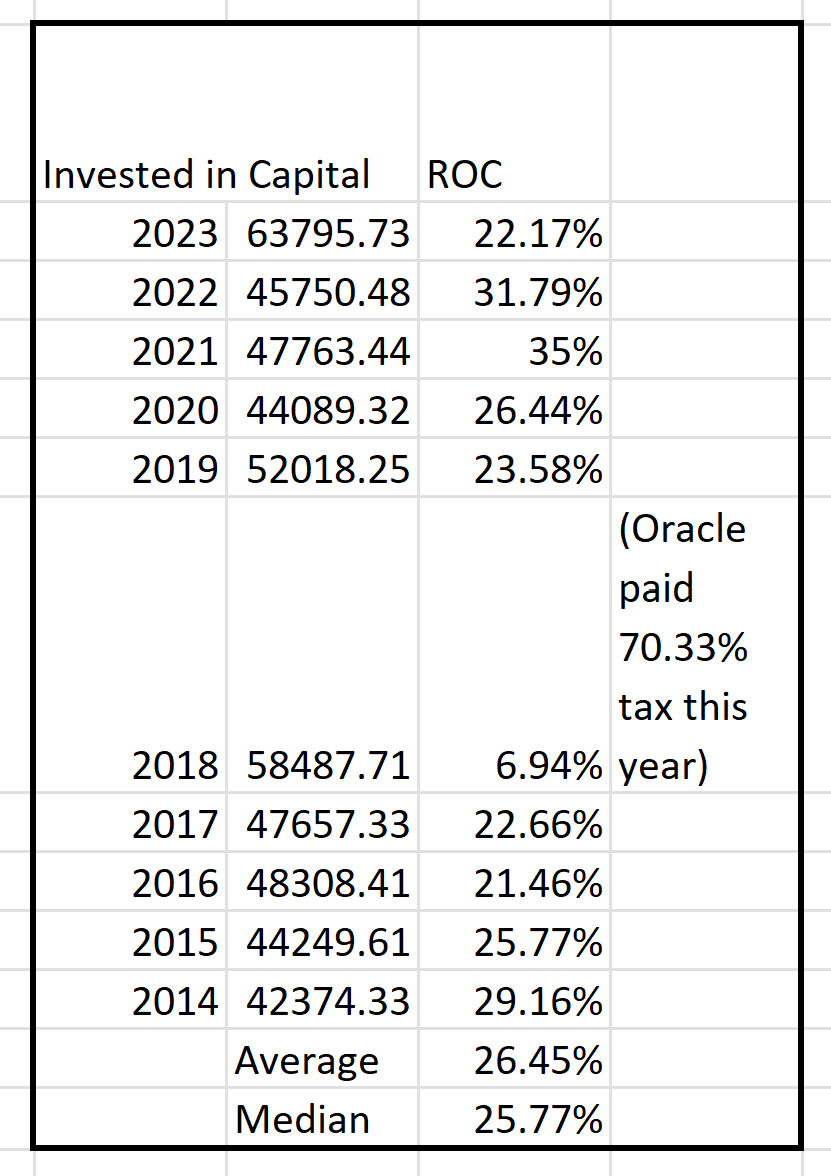
But as I said before, the money spent in net capex will not generate same effects as M&A.
So I set the growth rate in two phases:
For the next four years, I will calculate the reinvestment rate using the formula below.

Then, after four years, I gradually decreased the growth rate to 3.3% in year 10, the long-term average US economy growth rate. By doing so, I expect Oracle to have 4 years of high growth, then still have growth but gradually decrease to be an average company. I did the same process for pre-tax operating margin while the 21.9% is the industry average Pre-tax operating margin for software(system application company).
Figure 12

Now come back to my original challenges:
I have 4 different average/median estimated annual M&A costs, and 4 different (with the 33% makes few sense) net capex/M&A, How do I know which one to use?
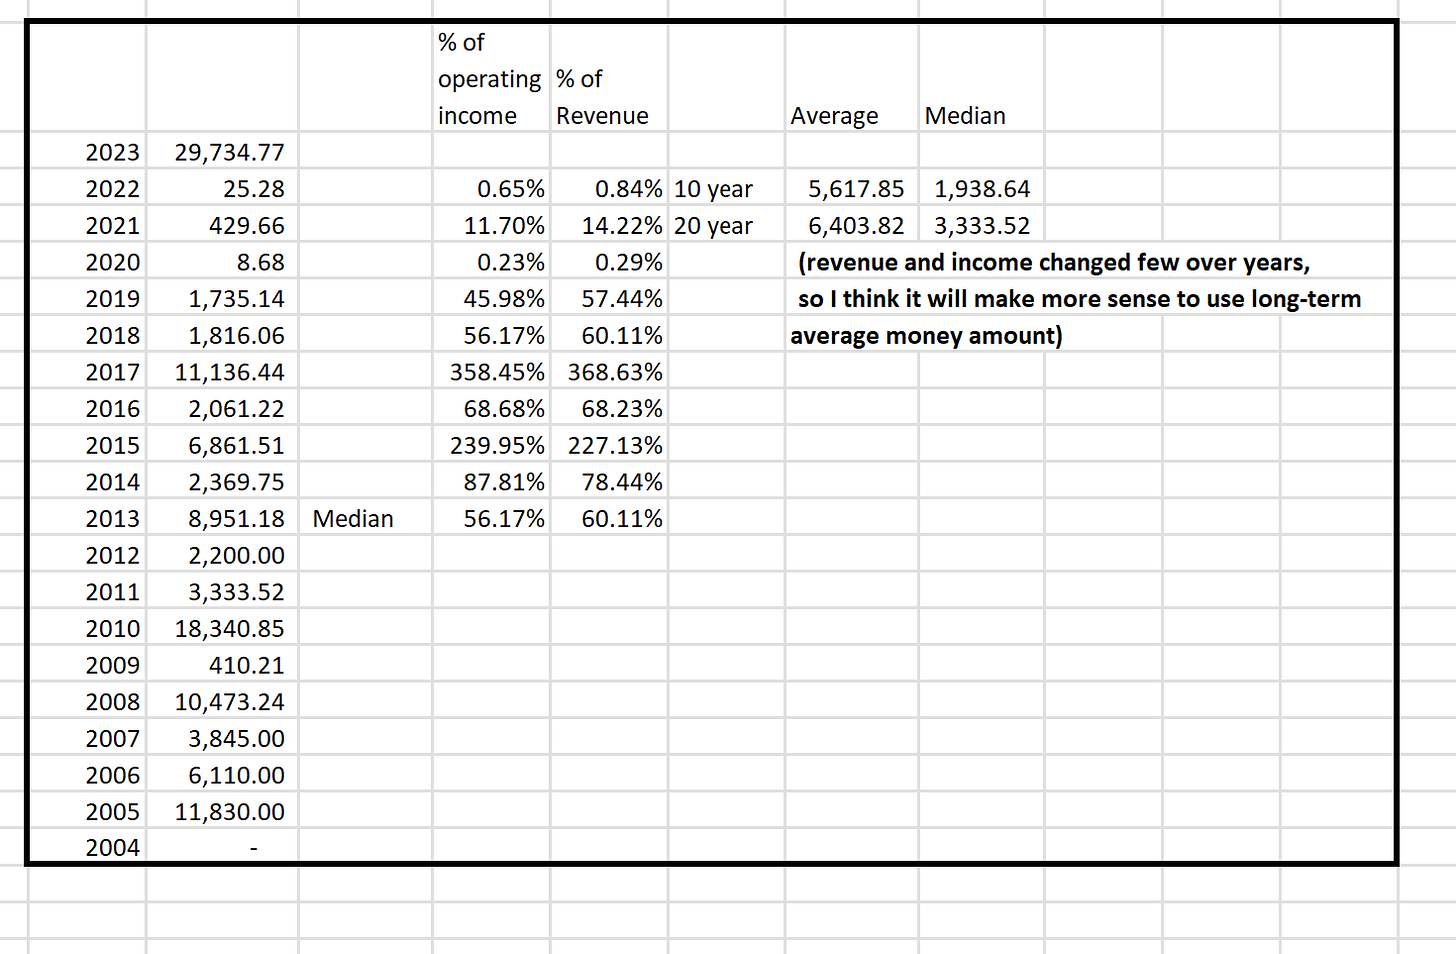
The good thing is that I can run scenario analysis with what-if analysis in Excel!
Figure 13
FCF cash flow with 4 scenarios of M&A expense and 10% Accounting NetCapex
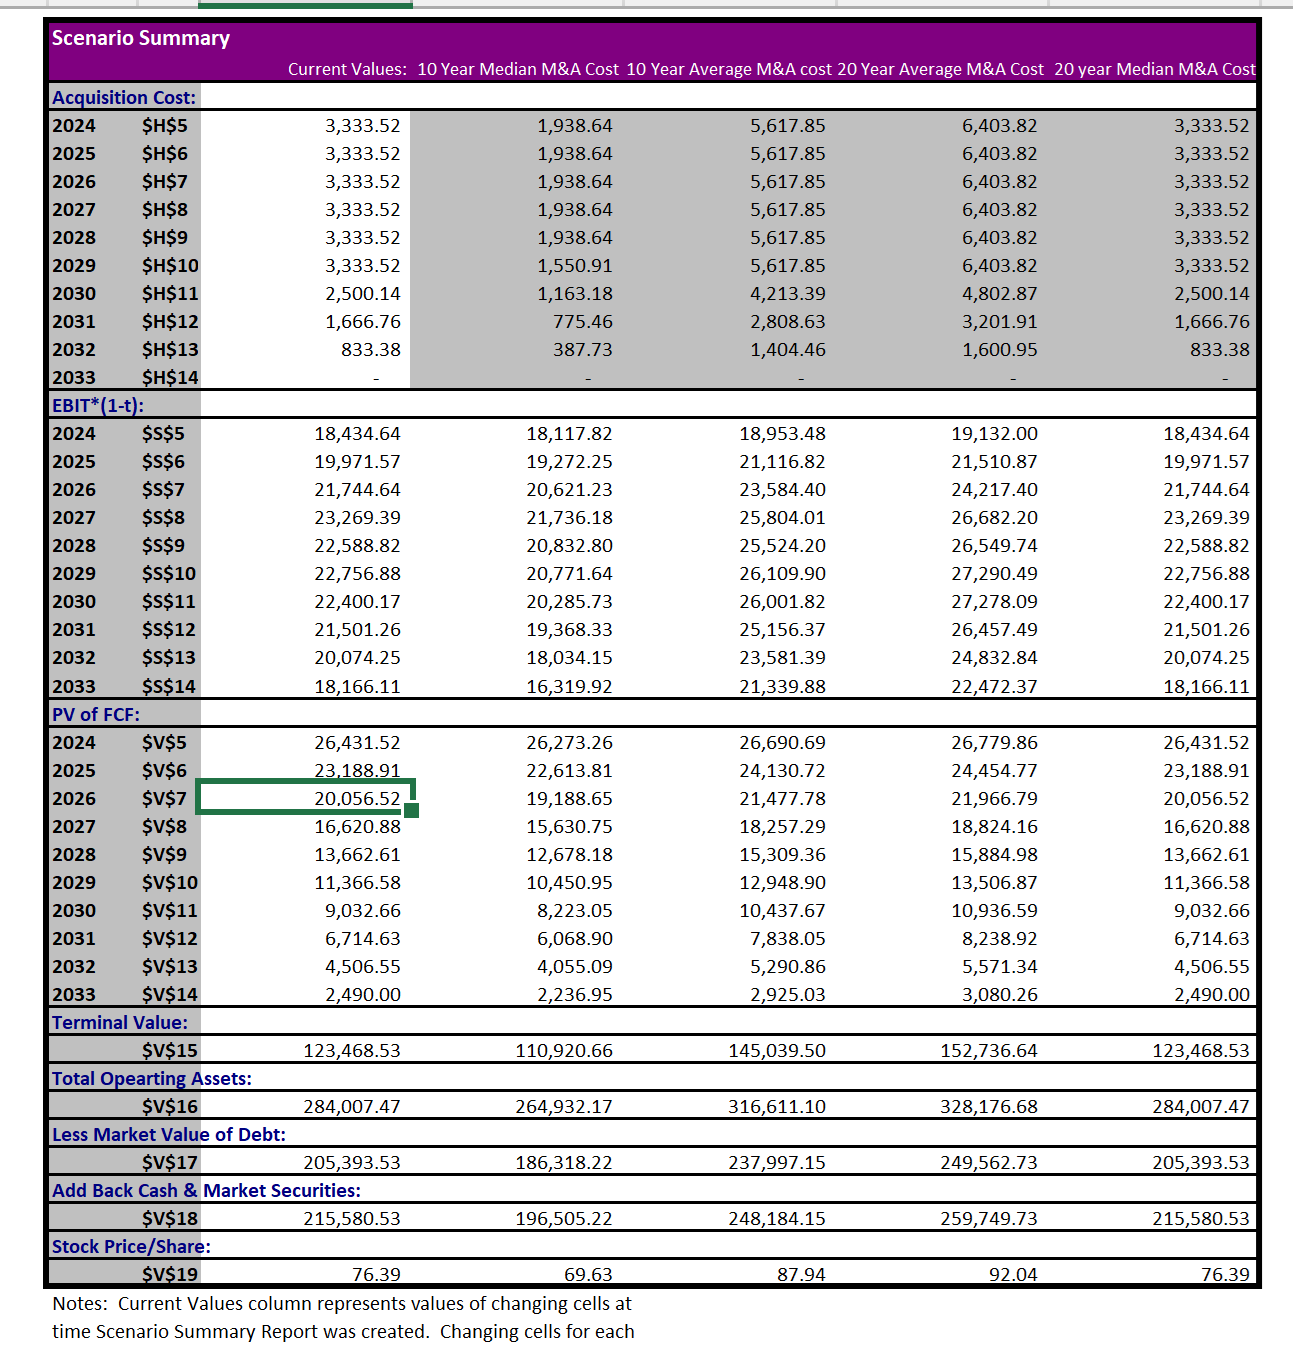
Figure 14
FCF cash flow with 4 scenarios of M&A expense and 19% Accounting NetCapex
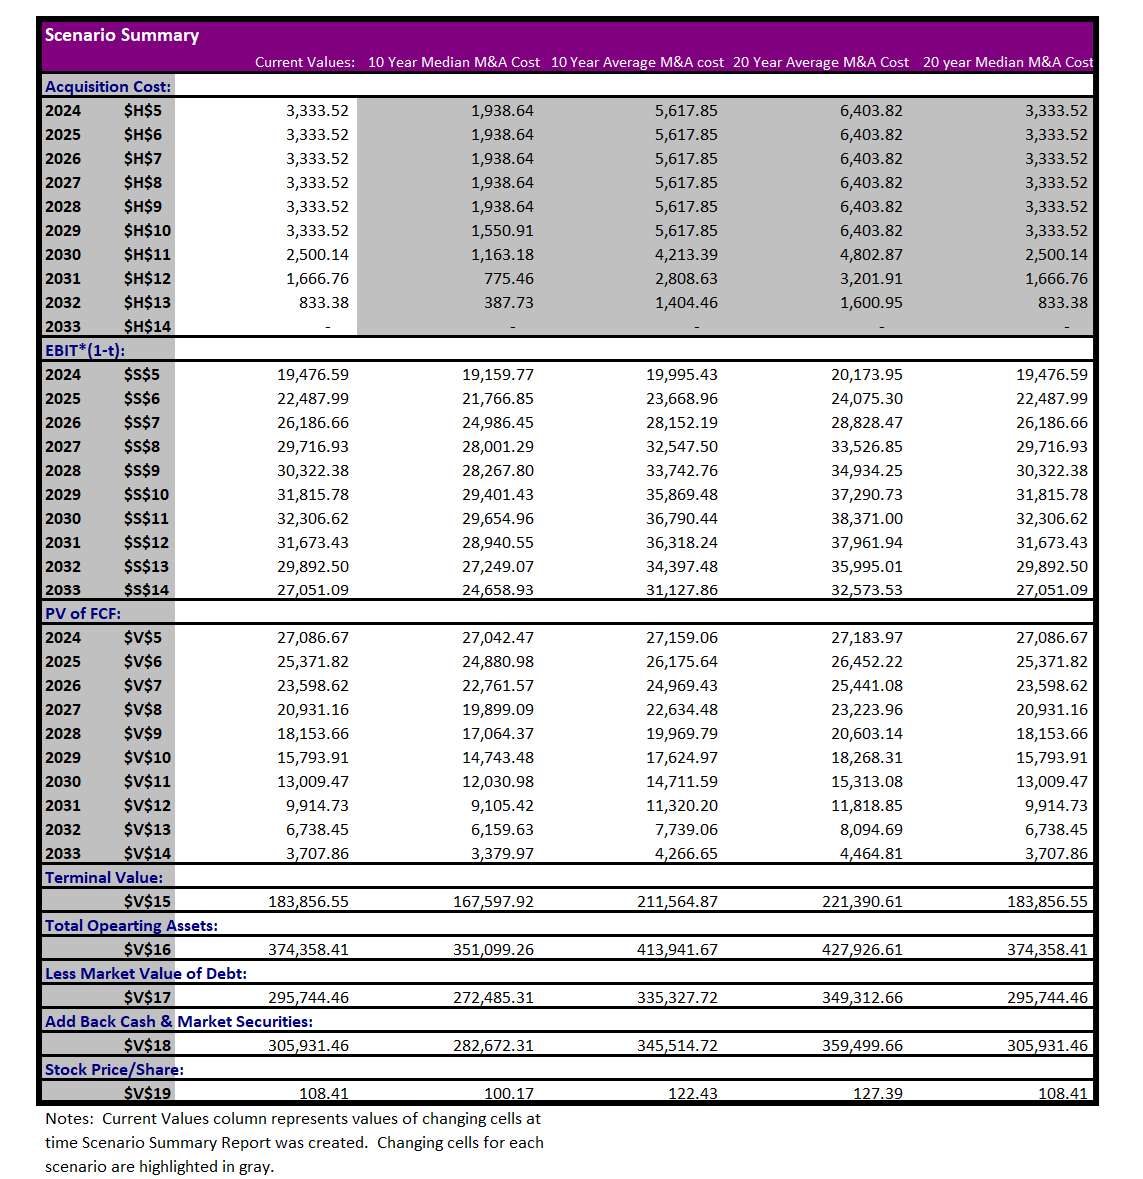
Figure 15
FCF cash flow with 4 scenarios of M&A expense and 33% Accounting NetCapex
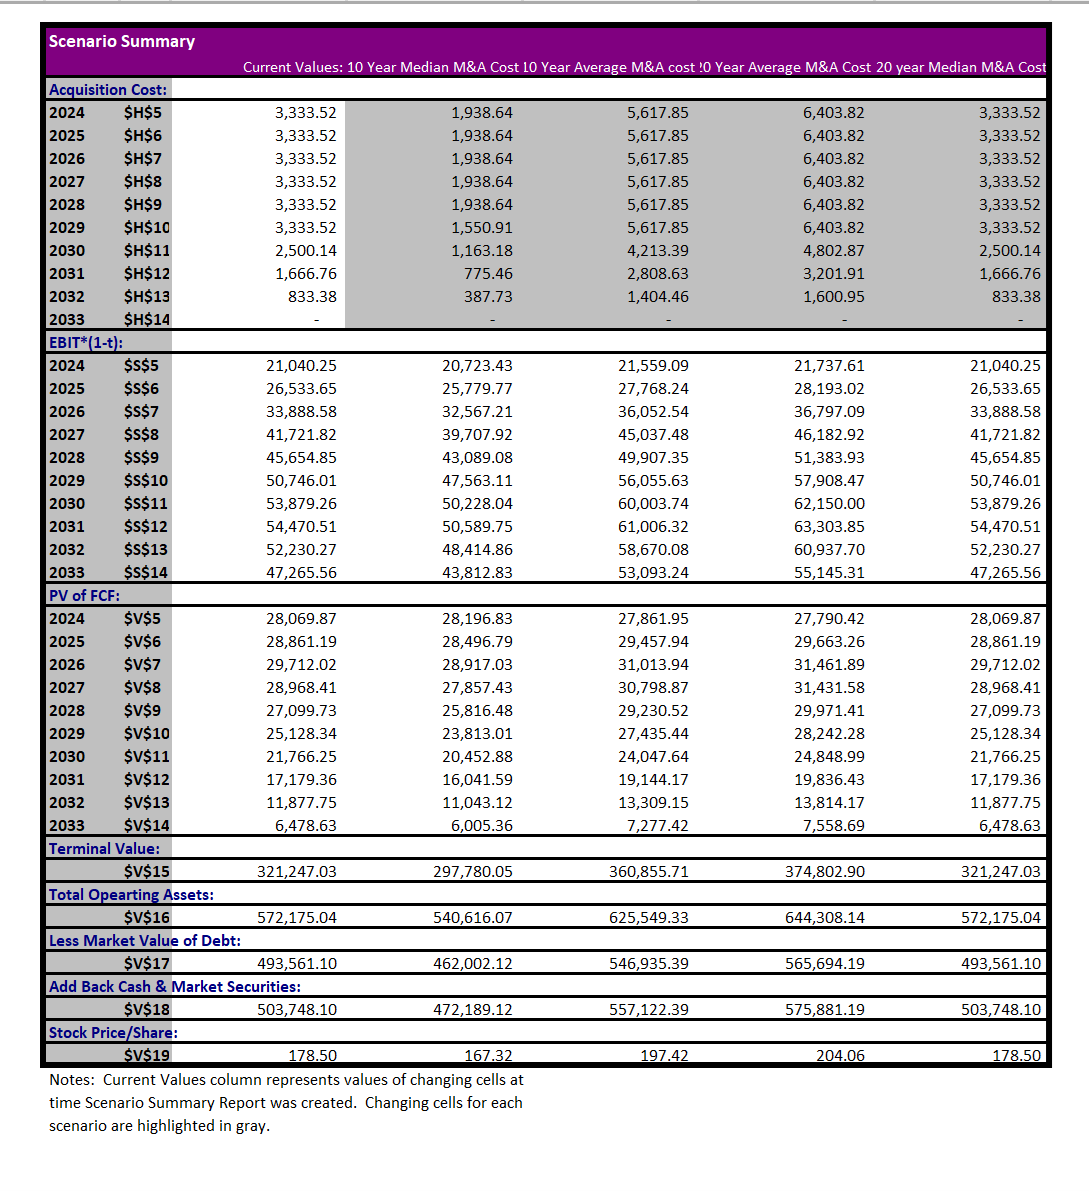
Note: The Market Value of Debt is from last post calculation, the cash and market securities are from the company’s most balance sheet, and the total shares used to calculate the price/share will be covered in next post.
With this information, I estimated the intrinsic value of Oracle stock as an investor.
The value is between $81.5-$96.1. (I think the 33% net capex scenario is too optimistic to realize since the industry average is 21.6%).
In addition, I also estimated how much trades will price the stock.
I am not interested in traders’ activity that much, but in my experience about bought Facebook stock at $189 when I valued the stock at $320-370. The stock, in fact, dropped to lower than $100 after I bought it before it jumped back to $320. So, forecasting traders’ behaviors can help me buy at an even lower price if their pricing returns a lower price than mine. By the same token, I can also know when to sell if their price target is much higher than my instinct value. After all, the market price in the short term is mainly made up of traders. But as an investor, I believe the price will reflect the value in the long run.
Figure 16
Traders's pricing
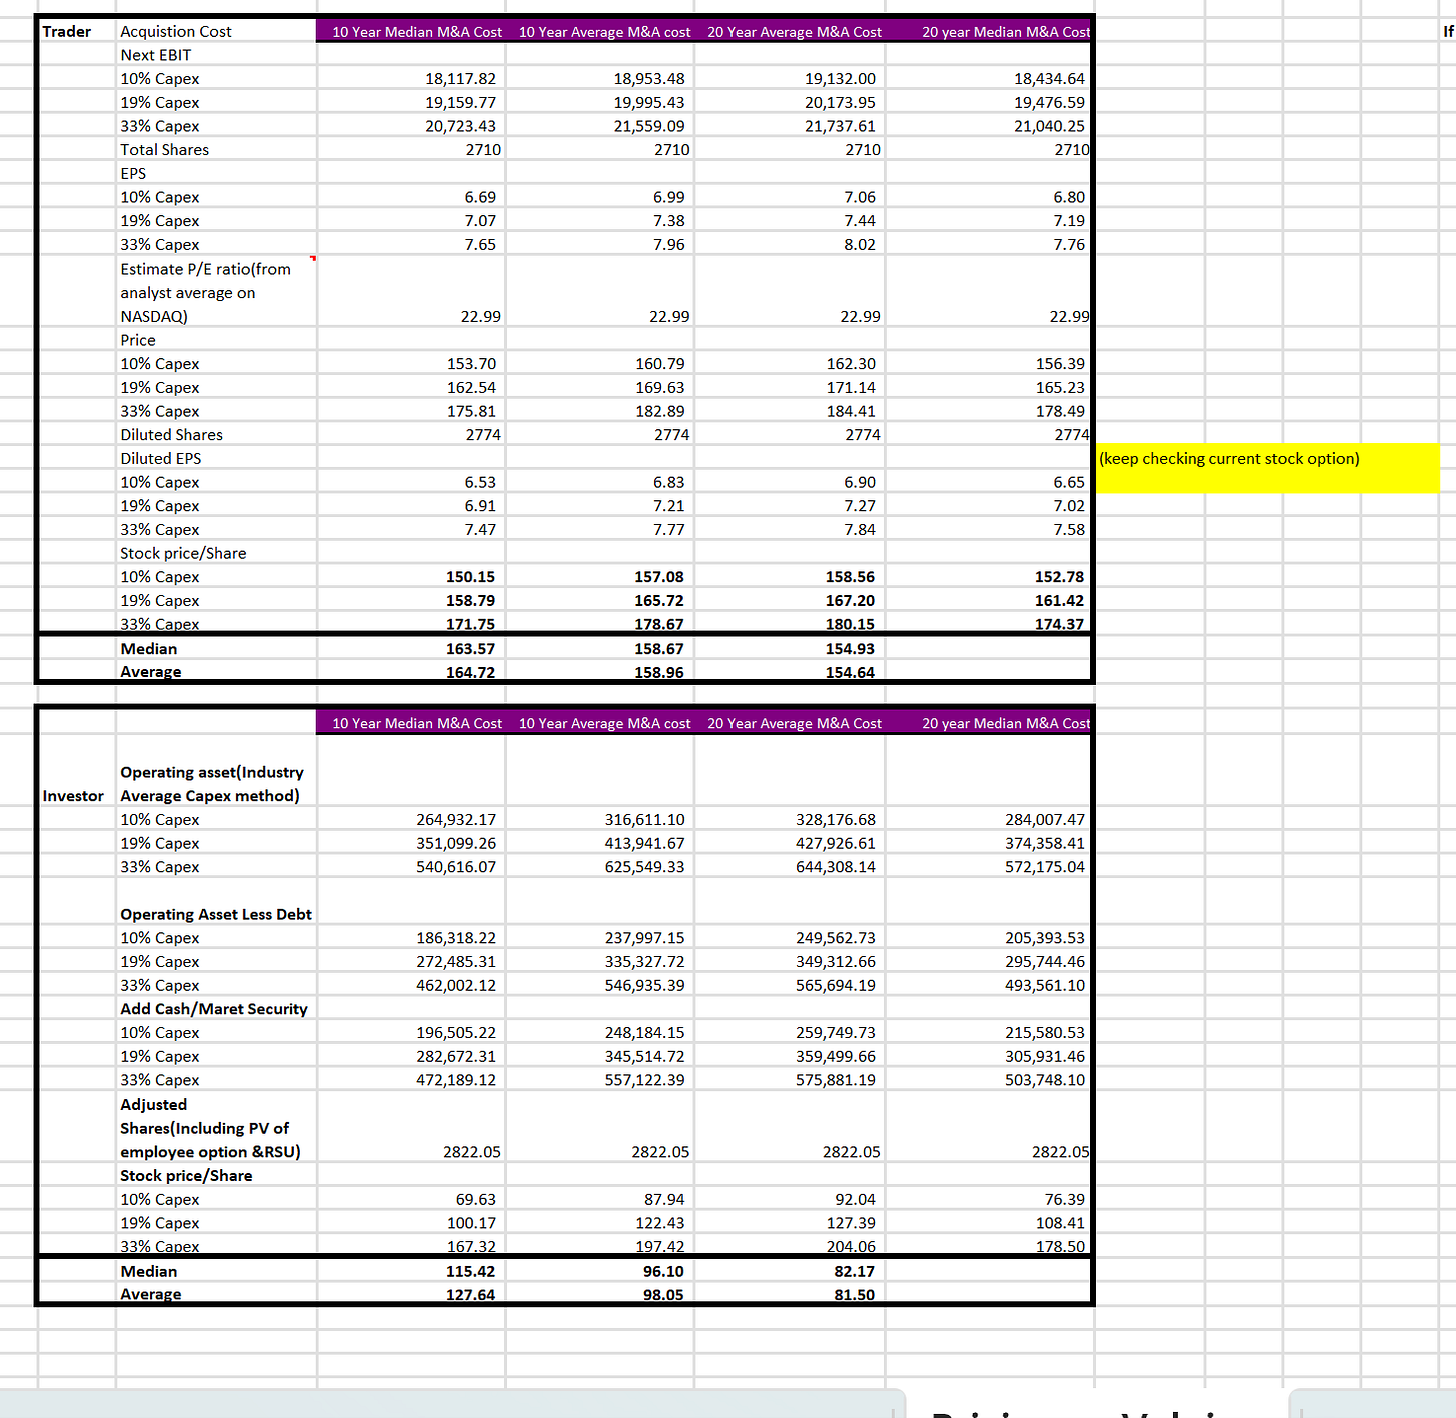
Since traders use the price/earning per share ratio and earning per share to price the stock.
And traders usually only care about the short-term, like the next quarter or year’s earnings.
I use the estimated 2024 earnings/shares and multiply that with the P/E ratio. Notice that I also calculated the diluted shares and diluted EPS by adding the total shares outstanding with the total stock options on balance right now. I want to remind you that this was never the right way to value stock compensation, but since I want to forecast a trader’s price target, I behave like him.
But what if the traders increase the price target in the future and I may have more capital gains by holding the stock?
Recall that in Figure 13-15 I estimated the operating income(EBIT) for the next 10 years. I use the highest year's EBIT to estimate the traders' possible highest price target.
Figure 17
Traders's possible pricing for next 10 years
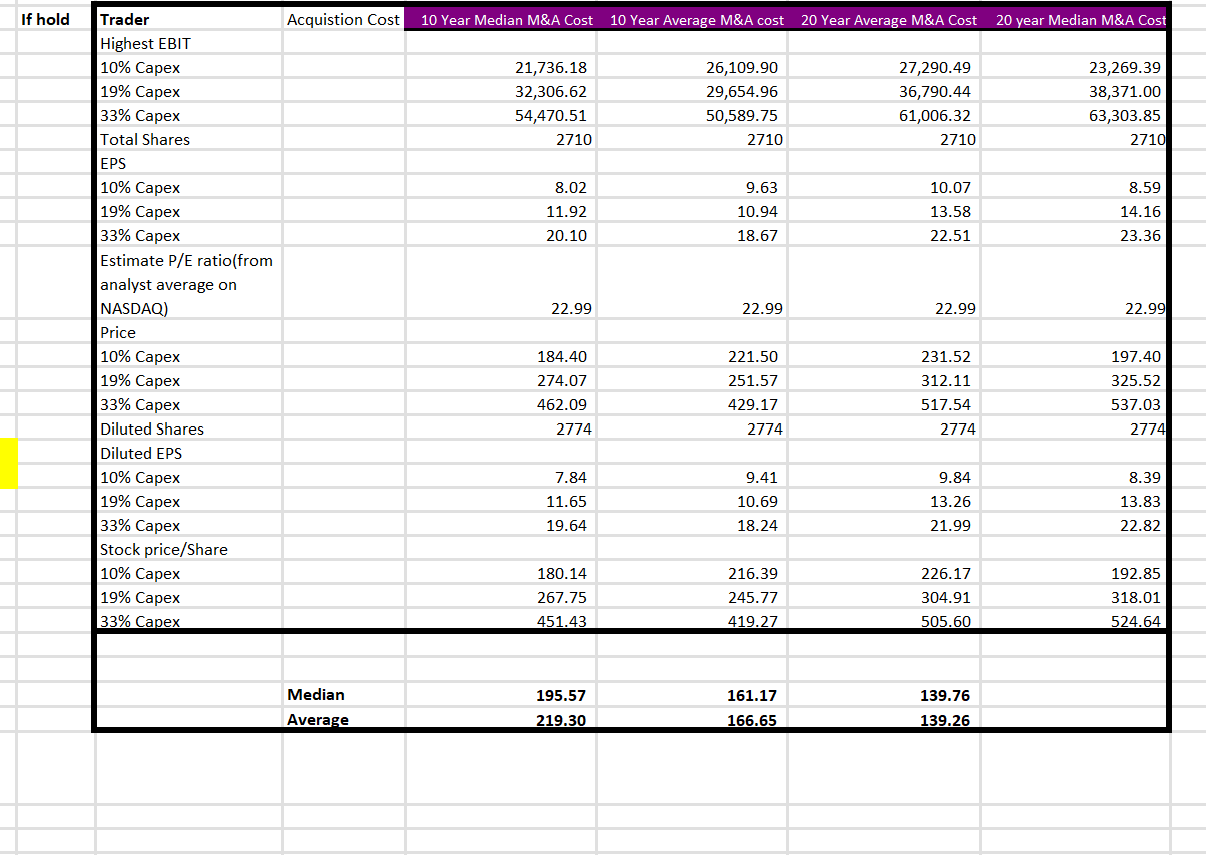
However, holding stock has opportunity costs. By holding a stock, I will lose possible returns if I sell it earlier and reinvest in other places. Since the long-term SP500 stock return is 10% and the possible highest traders's price target will happen in the year 2028.
I discount the price in Figure 7 by (1+10%)^5.
The final result I got is:
(I don't consider the 33% capex scenario since I think that is too optimistic of Oracle's future growth).
Fundamental investors-intrinsic value: $81.5-$98.05. (Price range I will buy again)
Current Traders' pricing: $154.64-$158.96.(Price range I will sell.)
Present value of future traders' highest price by holding the stock:$139.26-166.25.
If you want to learn how to value the real stock compensation cost, check my next post here.


